-
Chalk is denser than air. Explain why chalk dust floats in air.
(Solved)
Chalk is denser than air. Explain why chalk dust floats in air.
Date posted:
June 3, 2019
.
Answers (1)
-
The barometric height in a town is 65cmHg. Given that the standard atmospheric pressure is 76cmHg and the density of mercy is 13600kg/m³, determine the...
(Solved)
The barometric height in a town is 65cmHg. Given that the standard atmospheric pressure is 76cmHg and the density of mercy is 13600kg/m³, determine the attitude of the town. (Density of air is 1.25kg/m³).
Date posted:
June 3, 2019
.
Answers (1)
-
A burette has an initial reading of 22.5cm³. Determine the final reading after liquid of volume of 11.3cm³. To removal from the burette.
(Solved)
A burette has an initial reading of 22.5cm³. Determine the final reading after liquid of volume of 11.3cm³. To removal from the burette.
Date posted:
June 3, 2019
.
Answers (1)
-
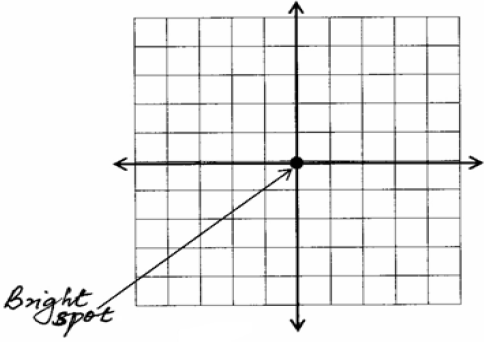
The Y-gain of a Cathode Ray Oscilloscope (C.R.O.) is set at 5 volts per division. A 20Vd.c. input is applied to the Y-plates and causes...
(Solved)
The Y-gain of a Cathode Ray Oscilloscope (C.R.O.) is set at 5 volts per division. A 20Vd.c. input is applied to the Y-plates and causes a deflection of the bright spot on the screen. Show on the screen below the new position of the bright spot.
Date posted:
June 3, 2019
.
Answers (1)
-
Describe how cathode rays are produced in a cathode ray oscilloscope.
(Solved)
Describe how cathode rays are produced in a cathode ray oscilloscope.
Date posted:
June 3, 2019
.
Answers (1)
-
Plane water wavefronts are incident onto a concave barrier as shown in the figure below.Show on the same diagram the nature of the reflected wavefronts.
(Solved)
Plane water wavefronts are incident onto a concave barrier as shown in the figure below.
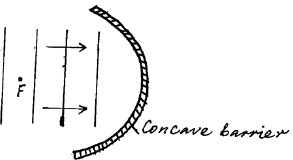
Show on the same diagram the nature of the reflected wavefronts.
Date posted:
June 3, 2019
.
Answers (1)
-
A vibrator is used to generate water waves in a ripple tank. It is observed that the distance between the first crest and the mid-point...
(Solved)
A vibrator is used to generate water waves in a ripple tank. It is observed that the distance between the first crest and the mid-point to the fifth trough is 237.5cm.
The waves travel 224.0cm in 6.0 seconds.
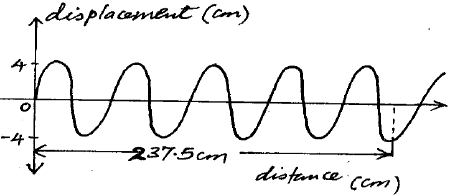
Determine:
(i) the wavelength of the waves.
(ii) the speed of the waves.
(iii) the frequency of the vibrator.
Date posted:
June 3, 2019
.
Answers (1)
-
The figure below shows water wave fronts approaching a boundary between a shallow and a deep region. The
speed of waves in the shallow region is...
(Solved)
The figure below shows water wave fronts approaching a boundary between a shallow and a deep region. The
speed of waves in the shallow region is less than in the deep region.
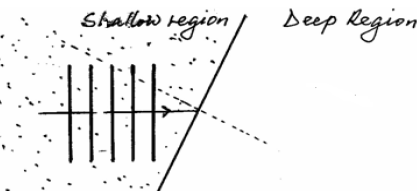
On the same diagram, complete the figure to show the wavefronts after crossing the boundary.
Date posted:
June 3, 2019
.
Answers (1)
-
The figure below shows a parabolic surface with a source of light placed at its focal point F.
Draw rays to show reflection from the surface...
(Solved)
The figure below shows a parabolic surface with a source of light placed at its focal point F.
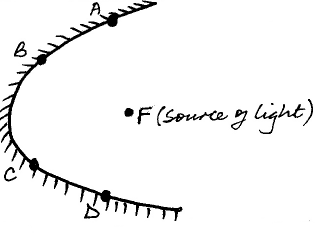
Draw rays to show reflection from the surface when rays from the source strike the surface at points A, B, C and D.
Date posted:
June 3, 2019
.
Answers (1)
-
An immersion heater rated 2.5KW is used in a home continuously for 50 minutes per day in a month of 30 days. Given that electricity...
(Solved)
An immersion heater rated 2.5KW is used in a home continuously for 50 minutes per day in a month of 30 days. Given that electricity costs Kshs.7.60 per unit (1 unit = 1kwh)), calculate:
(i) the number of KW transformed in the month.
(ii) the number of units (kwh) consumed in the month.
(iii) the total cost of the electric power consumed in the month given that there is a fixed charge of Kshs.150.00.
Date posted:
June 3, 2019
.
Answers (1)
-
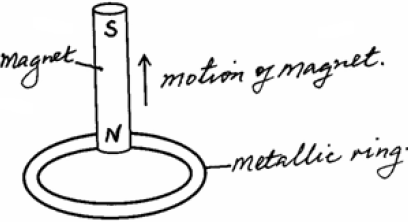
The north pole of a magnet is moved away from a metallic ring, as shown in the figure below. Show the direction of current induced...
(Solved)
The north pole of a magnet is moved away from a metallic ring, as shown in the figure below. Show the direction of current induced in the ring.
Date posted:
June 3, 2019
.
Answers (1)
-
A sample of Iodine-131 contains 1000g. If the half-life of Iodine-131 is 8 days, how much of the sample will remain undecayed after 40 days?
(Solved)
A sample of Iodine-131 contains 1000g. If the half-life of Iodine-131 is 8 days, how much of the sample will remain undecayed after 40 days?
Date posted:
June 3, 2019
.
Answers (1)
-
Sketch the Current-Voltage characteristic for a forward -biased diode.
(Solved)
Sketch the Current-Voltage characteristic for a forward -biased diode.
Date posted:
June 3, 2019
.
Answers (1)
-
The figure below shows a thick copper conductor placed between two poles of a strong magnet. The wire is free to swing in between the...
(Solved)
The figure below shows a thick copper conductor placed between two poles of a strong magnet. The wire is free to swing in between the poles.
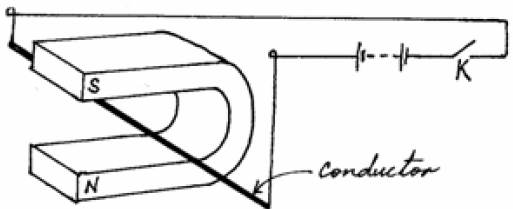
(a) Indicate on the same diagram the direction in which the conductor swings when the switch K is closed.
(b) State one change that can be made on the set up so that the direction of swing of the conductor is reversed.
Date posted:
June 3, 2019
.
Answers (1)
-
A girl standing 120m away from a tall building claps her hands and hears an echo 0.75s later. Determine the speed of sound in air...
(Solved)
A girl standing 120m away from a tall building claps her hands and hears an echo 0.75s later. Determine the speed of sound in air at this place.
Date posted:
June 3, 2019
.
Answers (1)
-
The figure below shows an incomplete circuit of an electromagnet.
Complete the circuit by drawing the windings on the two arms of the core so that...
(Solved)
The figure below shows an incomplete circuit of an electromagnet.
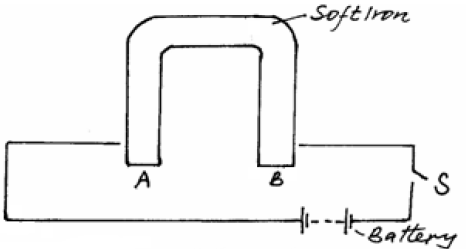
Complete the circuit by drawing the windings on the two arms of the core so that A and B are both north poles when the switch S is closed. Indicate the direction of the current of the windings drawn.
Date posted:
June 3, 2019
.
Answers (1)
-
A current of 0.8A flows through an electric circuit. Determine the quantity of charge that passes a point in the circuit in 6 minutes.
(Solved)
A current of 0.8A flows through an electric circuit. Determine the quantity of charge that passes a point in the circuit in 6 minutes.
Date posted:
June 3, 2019
.
Answers (1)
-
The figure below show two plane mirrors PQ and QR inclined at an angle of 1100.
A ray of light is incident on mirror PQ at...
(Solved)
The figure below show two plane mirrors PQ and QR inclined at an angle of 1100.
A ray of light is incident on mirror PQ at an angle 560.
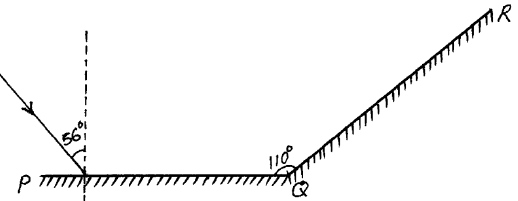
Complete the diagram to determine the angle of reflection of the ray in the mirror QR.
Date posted:
June 3, 2019
.
Answers (1)
-
The figure below shows an iron cylinder of length 10cm and uniform cross-section 2cm² suspended
from a spring balance with half of its length immersed in...
(Solved)
The figure below shows an iron cylinder of length 10cm and uniform cross-section 2cm² suspended
from a spring balance with half of its length immersed in paraffin oil of density 0.8gcmˉ³.
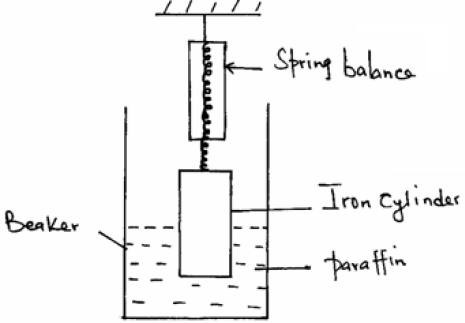
(i) Show on the diagram, the forces acting on the iron cylinder.
(ii) If the density of iron is 7.5gmˉ³ determine.
(i) the weight of the iron cylinder.
(ii) the reading of the spring balance.
Date posted:
June 3, 2019
.
Answers (1)
-
Draw a clear labeled diagram of a common hydrometer which is suitable for measuring the densities of liquid varying between 1.0 and 1.2 g/cm³.
(Solved)
Draw a clear labeled diagram of a common hydrometer which is suitable for measuring the densities of liquid varying between 1.0 and 1.2 g/cm³.
Date posted:
June 3, 2019
.
Answers (1)