-
The diagram below shows a simplified hydraulic braking system of a car.
(i) State the property of the liquid (oil) that makes its more suitable than...
(Solved)
The diagram below shows a simplified hydraulic braking system of a car.
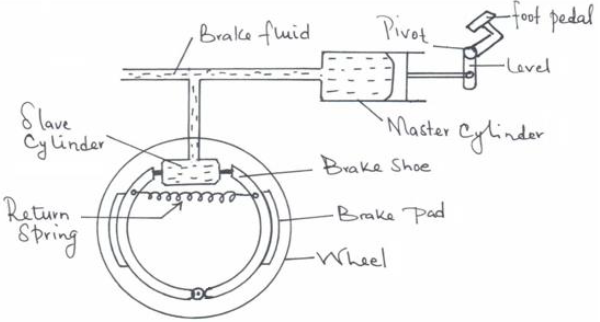
(i) State the property of the liquid (oil) that makes its more suitable than a gas for use as a brake fluid.
(ii) Explain how the system works starting from when the driver presses the foot pedal.
Date posted:
June 3, 2019
.
Answers (1)
-
Explain how a person is able to draw milk from a glass using a straw.
(Solved)
Explain how a person is able to draw milk from a glass using a straw.
Date posted:
June 3, 2019
.
Answers (1)
-
The following figure shows a wheel and axle used to raise a load W by applying an effort F. The radius of the larger wheel...
(Solved)
The following figure shows a wheel and axle used to raise a load W by applying an effort F. The radius of the larger wheel is R and the small wheel is y.
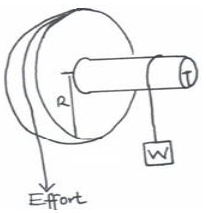
Given that v = 5cm and R is 8cm, determine the effort required to raise a load of 20N if the efficiency of the system is 80%.
Date posted:
June 3, 2019
.
Answers (1)
-
An immersion heater takes 30 minutes to heat 20kg of water from 250C to 600C. How long would the same heater take to heat the...
(Solved)
An immersion heater takes 30 minutes to heat 20kg of water from 250C to 600C. How long would the same heater take to heat the same mass of kerosene through the same temperature range. (Assume no heat is lost to the surrounding).
Specific heat capacity of water = 4200JKgˉ¹Kˉ¹
Specific heat capacity of kerosene = 2200JKgˉ¹Kˉ¹
Date posted:
June 3, 2019
.
Answers (1)
-
A ball of mass 100g is dropped from a height of 1.25m above the ground surface.
It rebounds to a height of 1.1m. Calculate
(i) velocity of...
(Solved)
A ball of mass 100g is dropped from a height of 1.25m above the ground surface.
It rebounds to a height of 1.1m. Calculate
(i) velocity of the ball before impact.
(ii) force of impact if the ball is in contact with the surface for 0.2S (g = 10N/kg).
Date posted:
June 3, 2019
.
Answers (1)
-
The figure below shows a set-up that can be used to verify Charles law of gases.
(i) State the measurements that should be taken in the...
(Solved)
The figure below shows a set-up that can be used to verify Charles law of gases.
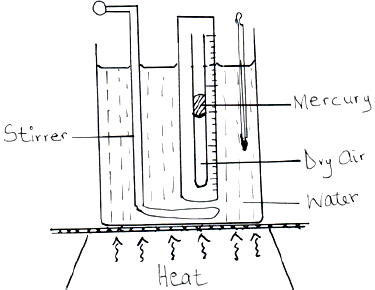
(i) State the measurements that should be taken in the experiment.
(ii) Explain how the measurements taken in (i) above can be used to verify Charles law.
Date posted:
June 3, 2019
.
Answers (1)
-
The diagram below shows an empty wine glass.
(a) State the effect on its stability when wine is put into the glass.
(b) Explain your answer in...
(Solved)
The diagram below shows an empty wine glass.
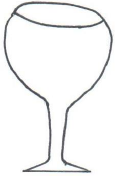
(a) State the effect on its stability when wine is put into the glass.
(b) Explain your answer in (a) above.
Date posted:
June 3, 2019
.
Answers (1)
-
The graph below shows stopping potential V against frequency for a photocell.
From the graph determine:
(i) Threshold frequency
(ii) Planck’s constant
(iii) Work function of the metal...
(Solved)
The graph below shows stopping potential V against frequency for a photocell.
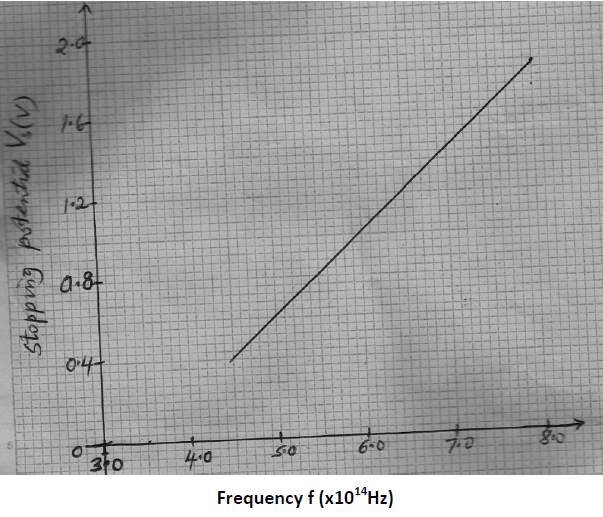
From the graph determine:
(i) Threshold frequency
(ii) Planck’s constant
(iii) Work function of the metal
(Takee = 1.6 x 10⁻¹⁹c)
Date posted:
June 3, 2019
.
Answers (1)
-
A student designed a transformer to provide power to an electric bell marked 24W, 6V from a 240V mains. He wound 50 turns and N...
(Solved)
A student designed a transformer to provide power to an electric bell marked 24W, 6V from a 240V mains. He wound 50 turns and N turns on an iron ring. When he a connected the coil of 50 turns to the bell and the N turns coil to an a.c, he found that the transformer was only 60% efficient. Find:
(i) The value of N
(ii) The power in the coil with N turns
Date posted:
June 3, 2019
.
Answers (1)
-
The figure below shows a set up by a student.
State and explain what happens to the sound from the buzzer as the bottle and its...
(Solved)
The figure below shows a set up by a student.
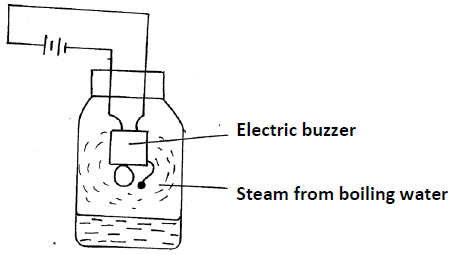
State and explain what happens to the sound from the buzzer as the bottle and its contents are cooled to 0oC
Date posted:
June 3, 2019
.
Answers (1)
-
A bullet of mass 20g moving at 400 m/s strikes a block of wood of mass 3.5kg initially at rest. The bullet sticks into the...
(Solved)
A bullet of mass 20g moving at 400 m/s strikes a block of wood of mass 3.5kg initially at rest. The bullet sticks into the block and the two move off together on a horizontal surface, where a frictional retarting force of 4N is acting between the block and surface.
(i) Determine the initial common velocity of bullet and wooden block.
(ii) What distance does the block move before coming to rest?
Date posted:
June 3, 2019
.
Answers (1)
-
A striker kicks a ball of mass 250g initially at rest with a force of 75N. if the foot was in contact with the ball...
(Solved)
A striker kicks a ball of mass 250g initially at rest with a force of 75N. if the foot was in contact with the ball for 0.10sec. Calculate the take off velocity of the ball.
Date posted:
June 3, 2019
.
Answers (1)
-
A test tube of mass 10g and uniform cross-sectional area 4cm2 is partly filled with lead shots and floats vertically in water with 5cm of...
(Solved)
A test tube of mass 10g and uniform cross-sectional area 4cm2 is partly filled with lead shots and floats vertically in water with 5cm of its length submerged.
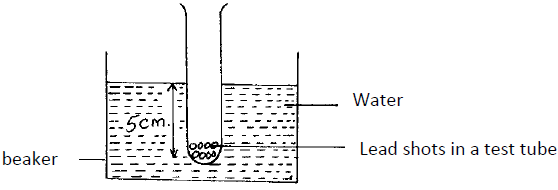
Find the:-
(i) Mass of the lead shots.
(ii) Length of the test tube that would be submerged in a liquid of density 0.75g/cm3.
Date posted:
June 3, 2019
.
Answers (1)
-
The effort piston of a hydraulic machine is of radius 2.8 cm, while that of the load piston is of radius 14cm. The machine raises...
(Solved)
The effort piston of a hydraulic machine is of radius 2.8 cm, while that of the load piston is of radius 14cm. The machine raises a load of 120 kg at a constant velocity through 2.5m. If the machine has an efficiency of 80%, find:-
(i) the velocity ratio of the hydraulic machine.
(ii) The mechanical advantage of the hydraulic machine.
(iii) The effort needed to raise the load.
Date posted:
June 3, 2019
.
Answers (1)
-
A spherical ball bearing of mass 0.0024 kg is held between the anvil and spindle of a micrometer screw gauge. The reading on the gauge...
(Solved)
A spherical ball bearing of mass 0.0024 kg is held between the anvil and spindle of a micrometer screw gauge. The reading on the gauge when the jaws are closed without anything in between is 0.11mm. Use this information and the position of the scale in the figure below to answer the questions (a) and (b) below:
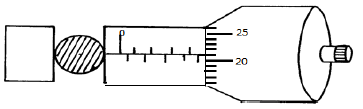
a) What is the diameter of the ball bearing?
b) Find the density of the ball bearing correct to 3 significant figures
Date posted:
June 3, 2019
.
Answers (1)
-
A transformer is used on a 240V a.c supply to deliver 12A at 120V to a heating coil. If 20% energy is lost at the...
(Solved)
A transformer is used on a 240V a.c supply to deliver 12A at 120V to a heating coil. If 20% energy is lost at the transformer, calculate the current in the primary coil.
Date posted:
June 3, 2019
.
Answers (1)
-
Figure below shows sound waves emitted by a drum struck.
Explain why the wave fronts are directed towards the ground.
(Solved)
Figure below shows sound waves emitted by a drum struck.
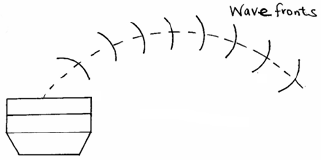
Explain why the wave fronts are directed towards the ground.
Date posted:
June 3, 2019
.
Answers (1)
-
A student set up a mass attached to a spring such that when it oscillates, it taps on water surface in a wide shallow tank.
The...
(Solved)
A student set up a mass attached to a spring such that when it oscillates, it taps on water surface in a wide shallow tank.
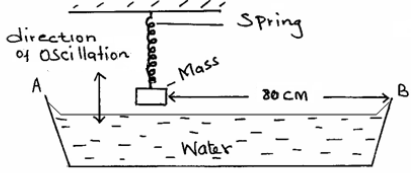
The student measured time for 20 oscillations and found that the mass takes 36 seconds. Given that the student counted four rippies between the mass and end B of the tank. Determine the speed of the waves.
Date posted:
June 3, 2019
.
Answers (1)
-
The figure below shows an electroscope being charged by induction.
(i) State the reason why the cap of the electroscope is made circular.
(ii) On the...
(Solved)
The figure below shows an electroscope being charged by induction.
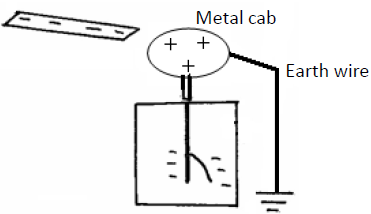
(i) State the reason why the cap of the electroscope is made circular.
(ii) On the same diagram, show the direction of the flow of electrons on the earth wire.
Date posted:
June 3, 2019
.
Answers (1)
-
The figure below shows rectangular block of height 4cm floating vertically in a beaker containing two
immiscible liquid A and B. The densities of the liquid...
(Solved)
The figure below shows rectangular block of height 4cm floating vertically in a beaker containing two
immiscible liquid A and B. The densities of the liquid are 8000 kg/m³ and 12,000kg/m³ respectively.
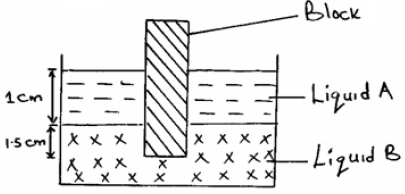
The cross sectional area is 2cm².
Determine.
(i) the weight of the liquid A displaced by the black.
(ii) the weight of the liquid B displaced by the block.
(iii) the mass of the block.
(iv) the density of the block.
Date posted:
June 3, 2019
.
Answers (1)