-
A point (-5, 4) is mapped onto (-1, -1) by a translation T. Find the image of (-4, 5) under the same translation.
(Solved)
A point (-5, 4) is mapped onto (-1, -1) by a translation T. Find the image of (-4, 5) under the same translation.
Date posted:
August 27, 2019
.
Answers (1)
-
A trader purchases four 25kg bags of sugar and packages the sugar in 2kg, 1kg and 0.5kg packs to be sold in retail. The trader...
(Solved)
A trader purchases four 25kg bags of sugar and packages the sugar in 2kg, 1kg and 0.5kg packs to be sold in retail. The trader does the packaging in a ratio of 3:2:5 respectively. He makes a profit of Kshs 10 for every 2kg pack, Kshs 8 for the 1kg pack and Kshs 6 for the 0.5kg pack.
(a) Determine;
(i) The number of packets the trader made for each type of package.
(ii) The profit he will make if the wholesale price of a 25kg bag of sugar is Kshs 2000
(iii) The selling price of each type of package.
(b) Determine his percentage profit.
Date posted:
August 27, 2019
.
Answers (1)
-
Two similar containers have capacities of 1000 litres and 1728 litres respectively. If it costs Ksh.750 to paint the outside surface of the smaller container,...
(Solved)
Two similar containers have capacities of 1000 litres and 1728 litres respectively. If it costs Ksh.750 to paint the outside surface of the smaller container, how much will it cost to paint the outside of the larger container.
Date posted:
August 27, 2019
.
Answers (1)
-
A car was valued at Ksh.3000000 in January 2000. Each year its value decreased by 12% of its value at the beginning of the year....
(Solved)
A car was valued at Ksh.3000000 in January 2000. Each year its value decreased by 12% of its value at the beginning of the year. Find the value of the car in January 2004 giving your answer correct to 4s.f.
Date posted:
August 27, 2019
.
Answers (1)
-
Find the centre and radius of a circle with equation x² + y² - 6x + 8y – 11 = 0
(Solved)
Find the centre and radius of a circle with equation x² + y² - 6x + 8y – 11 = 0
Date posted:
August 27, 2019
.
Answers (1)
-
Two alloys Y and Z are each made up of zinc, tin and copper. In alloy Y, the ratio of zinc to tin is 2:5...
(Solved)
Two alloys Y and Z are each made up of zinc, tin and copper. In alloy Y, the ratio of zinc to tin is 2:5 and the ratio of copper to tin is 4:3. Determine the ratio, copper: zinc: tin in alloy Y.
Date posted:
August 27, 2019
.
Answers (1)
-
After being given a discount of sh.5 on every book I bought, I was able to buy 2 more books than before. I was given...
(Solved)
After being given a discount of sh.5 on every book I bought, I was able to buy 2 more books than before. I was given the discount with sh.200. What was the price of one book before the discount?
Date posted:
August 27, 2019
.
Answers (1)
-
Obtain the binomial expansion of (1 - 2x)5 and use your expansion to evaluate (0.98)5 correct to 5d.p.
(Solved)
Obtain the binomial expansion of (1 - 2x)5 and use your expansion to evaluate (0.98)5 correct to 5d.p.
Date posted:
August 27, 2019
.
Answers (1)
-
A bus left Nairobi and travelled towards Busia at an average speed of 90km/hr. After2 2/9 hours, a car left Nairobi and travelled along the...
(Solved)
A bus left Nairobi and travelled towards Busia at an average speed of 90km/hr. After 2 2/9 hours, a car left Nairobi and travelled along the same road at an average speed of 170km/hr. If the distance between Nairobi and Busia is 800km, Determine the distance the car travelled to catch up with the bus.
Date posted:
August 27, 2019
.
Answers (1)
-
The gradient of the curve whose equation is given by y= ax3 — 20x2 +10x at the point where x=2 is 410. Find the value...
(Solved)
The gradient of the curve whose equation is given by y= ax3 — 20x2 +10x at the point where x=2 is 410. Find the value of a.
Date posted:
August 27, 2019
.
Answers (1)
-
The exchange rate during a certain day of February was as shown below.
(Solved)
The exchange rate during a certain day of February was as shown below.
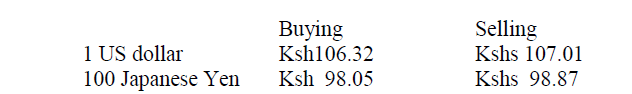
A tourist landed in Kenya and converted 5500 US dollars to Kshs. While in Kenya he spent Kshs 186,000. He then converted the money back to Japanese Yen before travelling to Japan. Calculate the amount of Japanese Yen he had to the nearest Yen.
Date posted:
August 27, 2019
.
Answers (1)
-
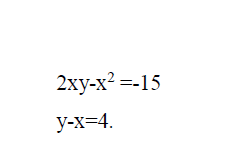
Solve the equation given below.
(Solved)
Solve the equation given below.
Date posted:
August 27, 2019
.
Answers (1)
-
A straight line passing through the point C (1, 3) and D (x, -5) is perpendicular to the line whose
equation is 4y-3x+5=0.Determine the value of...
(Solved)
A straight line passing through the point C (1, 3) and D (x, -5) is perpendicular to the line whose
equation is 4y-3x+5=0.Determine the value of x and the equation of the line CD.
Date posted:
August 27, 2019
.
Answers (1)
-
A cylindrical column of oil has radius 4.25cm and has height of 20cm.Calculate the mass of the oil if the column has density of 3.524g/cm3
(Solved)
A cylindrical column of oil has radius 4.25cm and has height of 20cm.Calculate the mass of the oil if the column has density of 3.524g/cm3
Date posted:
August 27, 2019
.
Answers (1)
-
Find the values of a and b.
(Solved)
Given that 
Find the values of a and b.
Date posted:
August 27, 2019
.
Answers (1)
-
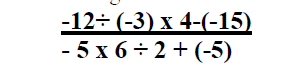
Without using a calculator evaluate
(Solved)
Without using a calculator evaluate 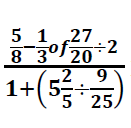 leaving your answer as a mixed fraction.
Date posted:
August 27, 2019
.
Answers (1)
-
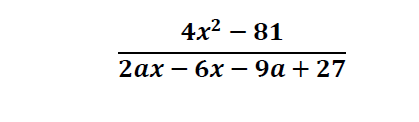
Simplify the following expression.
(Solved)
Simplify the following expression.
Date posted:
August 27, 2019
.
Answers (1)
-
Without using mathematical tables or calculator, evaluate;
(Solved)
Without using mathematical tables or calculator, evaluate;
Date posted:
August 27, 2019
.
Answers (1)
-
In the figure below OAB is a triangle, OA = a, OB = b. Point M lies on AB such thatAM : MB = 1:3...
(Solved)
In the figure below OAB is a triangle, OA = a, OB = b. Point M lies on AB such that AM : MB = 1:3 and N lies on OB such that OB : BN = 7: - 5. Line OM and AN intersect at X.
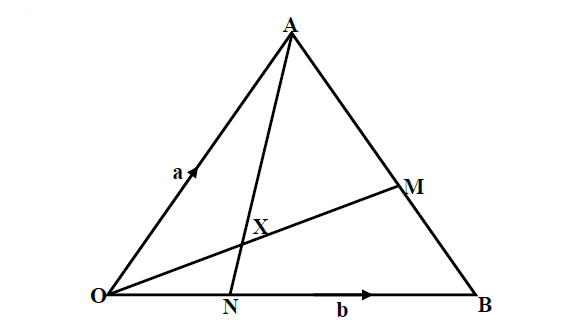
a) Express in terms of a and b;
(i) OM
(ii) AN
b) Given that OX=kOM and AX=hAN where k and h are scalars.
(i) Write down two expressions for OX in terms of a, b, h and k.
(ii) Find the values of h and k.
(iii) Determine the ratio in which X divides AN.
Date posted:
August 27, 2019
.
Answers (1)
-
In the figure below O is the centre of the circle. A, B, C and D are points on the circumference of the circle. A,...
(Solved)
In the figure below O is the centre of the circle. A, B, C and D are points on the circumference of the circle. A, O, X,C and E are on a straight line. DE is a tangent to the circle at D. Angle BOC = 480 and angle CAD = 360
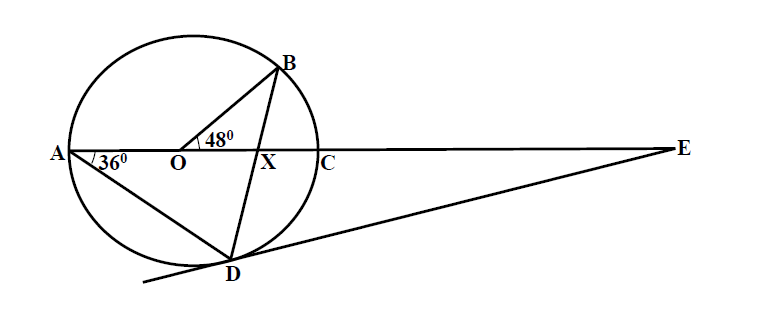
a) Find the value of;
(i) Angle CBA.
(ii) Angle BDE.
(iii) Angle CED.
b) If AX = 12cm, XC = 4cm, DB = 14cm and DE = 15cm. Calculate;
(i) DX.
(ii) AE.
Date posted:
August 27, 2019
.
Answers (1)