Get premium membership and access questions with answers, video lessons as well as revision papers.

The table below shows the value in Ksh Million of exports from Kenya and imports from the main geographical regions of the world in 2016....


The table below shows the value in Ksh Million of exports from Kenya and imports from the main geographical regions of the world in 2016. Use it to answer question (a) and (b).

cropi.png

(a)

(i) What is the difference in value between exports and imports from Africa?

(ii) Calculate the total value of imports in the year 2016.

(iii) What is the percentage of the region with the least export value in 2016?

(b)
(i) A part from comparative bar graphs, give two other statistical methods that can be usedto present the data in the table.

(ii) Using a vertical scale of 1cm to represent Ksh 50 Billion, draw a comparative bar graph to present the data.

(iii) State three conclusions that can be made from the graph that you have drawn.

(c) State four characteristics of bar graphs.


Answers


Martin
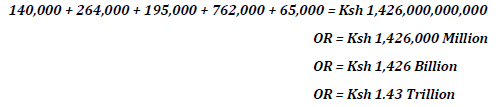
i)Ksh 235,000 million – Ksh 140,000 = Ksh 95,000 million
OR = Ksh 95,000,000,000
OR = Ksh 95 Billion

ii)deas.png

iii)crp.png

i)-Comparative line graph.
-Proportional divided circles

ii)hrd.png

iii)
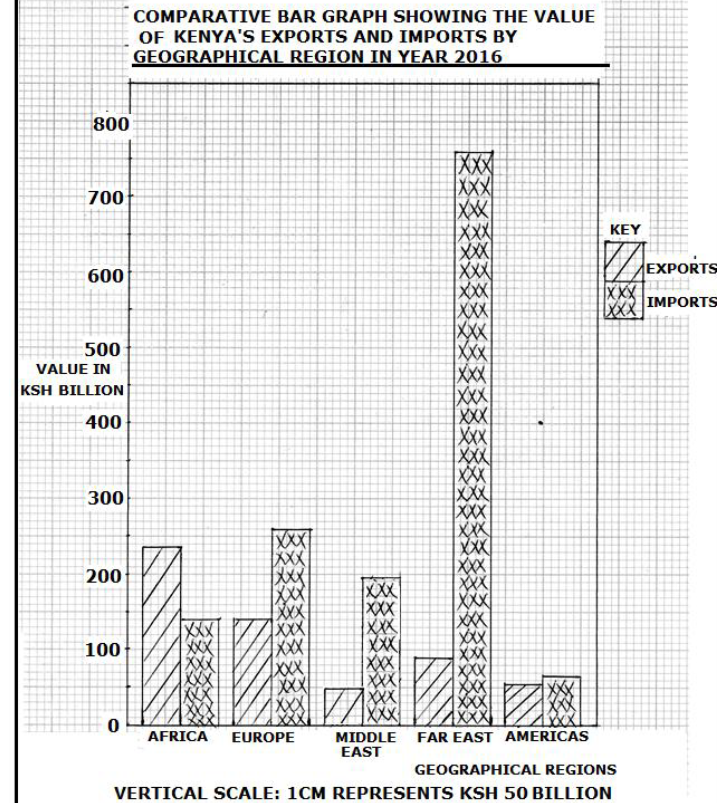
- Value of exports to Africa was higher than imports.
- Value of exports and imports from Americas were almost equal.
- Exports to the Middle East region had the least value.
- Imports from the Far East had the highest value.
- Imports from Americas had the lowest value

c)
- Bar graphs are two dimensional
-All bars originate from zero.
-Bars representing the same item/commodity are shaded uniformly.
- The width of the bars must be uniform.
-Space in between bars in some bar graphs must be uniform.
- Dependent variables are plotted along the vertical axis.
- Independent variables are plotted along the horizontal axis.
-Bar graphs must have a comprehensive title.
marto answered the question on September 11, 2019 at 06:48


Next: A cork enclosing steam in a boiler is held down by the system shown below.
Previous: An aircraft 320m from the ground travelling horizontally at 50m/s releases a bomb. Calculate the horizontal distance covered by the bomb from the point of...

View More Geography Questions and Answers | Return to Questions Index


Learn High School English on YouTube

Related Questions