-
The table below gives the solubility of potassium bromide and potassium sulphate at 00C and 800C.
(Solved)
The table below gives the solubility of potassium bromide and potassium sulphate at 00C and 800C.
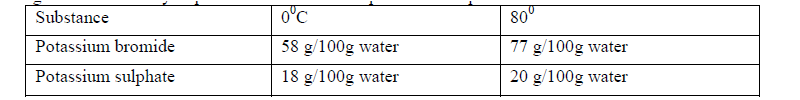
When an aqueous mixture containing 60g of potassium bromide and 7g of potassium sulphate in 100g of water was cooled from 800C to 00C, some crystals were formed.
(a) Identify the crystals.
(b) Determine the mass of crystals formed.
(c) Name the method used to obtain the crystals.
Date posted:
September 17, 2019
.
Answers (1)
-
Describe how solid Aluminium chloride can be separated from a solid mixture of sodium chloride and ammonium chloride.
(Solved)
Describe how solid Aluminium chloride can be separated from a solid mixture of sodium chloride and ammonium chloride.
Date posted:
September 17, 2019
.
Answers (1)
-
The relative atomic mass of an element is 10.28.
(Solved)
The relative atomic mass of an element is 10.28, it has two isotopes 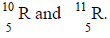
Calculate the relative percentage abundance of each isotope.
Date posted:
September 17, 2019
.
Answers (1)
-
The atomic number of Q and R are 9 and 17 respectively. Compare the electron affinity of Q and . Explain.
(Solved)
The atomic number of Q and R are 9 and 17 respectively. Compare the electron affinity of Q and . Explain.
Date posted:
September 17, 2019
.
Answers (1)
-
In order to determine the molar heat of neutralization of 1M potassium hydroxide, 200cm³ of 1M hydrochloric acid both at the same temperature were mixed...
(Solved)
In order to determine the molar heat of neutralization of 1M potassium hydroxide, 200cm³ of 1M hydrochloric acid both at the same temperature were mixed and stirred continuously with a thermometer. The temperature of the resulting solution was recorded after every 30 seconds until the highest temperature of the solution was attained.
(a) (i) Why was it necessary to stir the mixture of the two solutions?
(ii) Write an ionic equation for the reaction.
(b) The initial temperature for both solution was 24.5°C and the highest temperature attained by the mixture was 30.9°C. Calculate the
(i) heat change for the reaction.
(Specific heat capacity of the solution is  Density of the solution is
The volume of KOH used was 200cm³.
(ii) molar heat of the neutralisation.
(c) If ammonium hydroxide was used instead of potassium hydroxide the heat of neutralization would be different from the one obtained in b(ii) above.
Explain the difference.
(d) Draw an energy level diagram for the reaction between potassium hydroxide and hydrochloric acid.
Date posted:
September 16, 2019
.
Answers (1)
-
Explain why lead carbonate is not reacted with dil. H2SO4 in preparation of carbon (IV) oxide in the laboratory.
(Solved)
Explain why lead carbonate is not reacted with dil. H2SO4 in preparation of carbon (IV) oxide in the laboratory.
Date posted:
September 16, 2019
.
Answers (1)
-
The table below shows ammeter readings obtained where different electrolytes of the same concentration were tested.
(Solved)
The table below shows ammeter readings obtained where different electrolytes of the same concentration were tested.
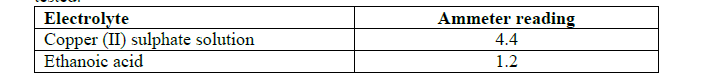
Explain why ethanoic acid gave a lower ammeter reading the copper (II) sulphate solution.
Date posted:
September 16, 2019
.
Answers (1)
-
Study the scheme given below and answer the questions that follow.
(Solved)
Study the scheme given below and answer the questions that follow.
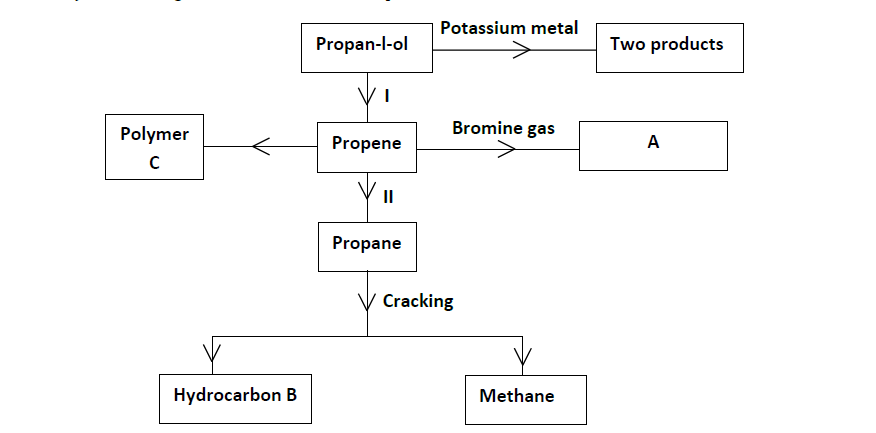
(i) Write an equation for the reaction between propan-l-ol and potassium metal.
(ii) Name process I and II.
(iii) Identify the products A and B.
(iv) Name one catalyst used in Process II.
(v) Draw the structural formula of the repeating unit in the polymer C.
(vi) Write the structural formula of 2, 3-dichloropropene.
Date posted:
September 16, 2019
.
Answers (1)
-
The grid below shows part of the periodic table. Use it to answer questions that follow. The letters do not represent the actual symbols of...
(Solved)
The grid below shows part of the periodic table. Use it to answer questions that follow. The letters do not represent the actual symbols of the elements.
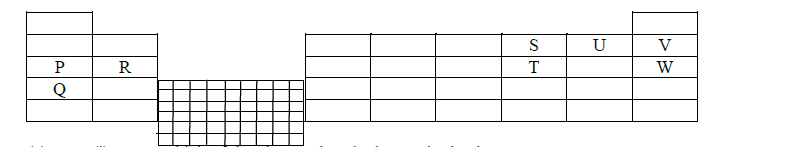
(a) (i) Which of the element has the lowest ionization energy?
(ii) Explain your answer in a(i) above.
(b) (i) Identify the most reactive non-metal.
(ii) Explain your answer in b(i) above.
(c) Give the electronic configuration of element.
(i) S
(ii) Q
(d) Compare the atomic radius of P and R. Explain.
(e) The mass number of W is 40. Write down the composition of its nucleus.
(f) Write formula of oxides of P.
(g) (i) What is the name given to elements found in the shaded region.
(ii) Which elements can be used to provide an inert environment?
Date posted:
September 16, 2019
.
Answers (1)
-
(a) Using electrons in the outermost energy level, draw and cross (x) diagram for H3O+ and C2H4 (H = 1, C = 6,O =...
(Solved)
(a) Using electrons in the outermost energy level, draw dots and crosses (x) diagram for H3O+ and C2H4 (H = 1, C = 6,
O = 16)
(b) What would be the effect of dipping litmus paper in aqueous solution of H3O+?
Date posted:
September 16, 2019
.
Answers (1)
-
The diagram below represent large scale manufacture of hydrochloric acid.
Study it and answer the questions that follow.
(Solved)
The diagram below represent large scale manufacture of hydrochloric acid.
Study it and answer the questions that follow.
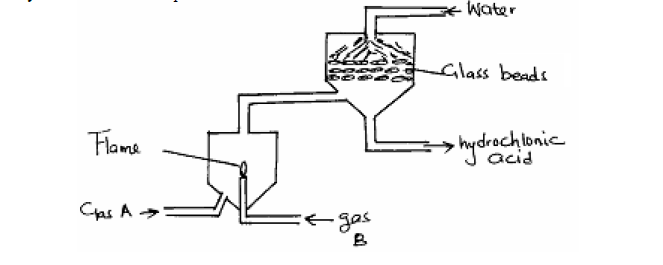
(a) Identify.
(i) Gas A
(ii) Gas B
(b) Write the chemical equation for the reaction between gas A and B.
Date posted:
September 16, 2019
.
Answers (1)
-
A student was provided with 1.5g of XCO3. He reacted it with 50cm³ of 1M HCl which was excess. Determine the volume of CO2 produced...
(Solved)
A student was provided with 1.5g of XCO3. He reacted it with 50cm³ of 1M HCl which was excess. Determine the volume of CO2 produced at S.T.P.
(R.F.M of x CO3 = 100) molar gas volume at S.T.P = 22400cm³.
Date posted:
September 16, 2019
.
Answers (1)
-
Sulphur (IV) oxide and nitrogen (IV) oxide reacts as shown in the equation below.
(Solved)
Sulphur (IV) oxide and nitrogen (IV) oxide reacts as shown in the equation below.
SO2 + NO2----->SO3(g) + NO(g)
(a) Using oxidation numbers show that this is a redox reaction.
(b) Identify the reducing agent.
Date posted:
September 16, 2019
.
Answers (1)
-
15cm³ of a gaseous hydrocarbon reacted completely with 45cm³ of oxygen. 30cm³ of carbon (IV) oxide were formed.
Determine the formula of the hydrocarbon given that...
(Solved)
15cm³ of a gaseous hydrocarbon reacted completely with 45cm³ of oxygen. 30cm³ of carbon (IV) oxide were formed.
Determine the formula of the hydrocarbon given that all volumes of gases were measured under the same conditions of temperature and pressure.
Date posted:
September 16, 2019
.
Answers (1)
-
The results of an experiment to determine the solubility of potassium chlorate in water at 30°C were as follows.
Mass of dish = 15.86g.
Mass of dish...
(Solved)
The results of an experiment to determine the solubility of potassium chlorate in water at 30°C were as follows.
Mass of dish = 15.86g.
Mass of dish + saturated solution at 30°C = 26.8g.
Mass of dish + solid potassium chlorate after evaporation to dryness = 16.86g.
Calculate the mass of saturated solution containing 60g of water at 30°C.
Date posted:
September 13, 2019
.
Answers (1)
-
Excess iron was allowed to rust in 2dm³ of most air and the volume of air remaining was measured at 1 atmospheric pressure each day.
(Solved)
Excess iron was allowed to rust in 2dm³ of most air and the volume of air remaining was measured at 1 atmospheric pressure each day.The results were as follows.

(i) Write an equation for the formation of rust.
(ii) On which day was the reaction complete. Explain.
(iii) What is the percentage volume of oxygen in air. Show your working.
Date posted:
September 13, 2019
.
Answers (1)
-
A given sample of ink is a mixture of red dye, blue dye and orange dye. The blue dye is least absorbed than the rest...
(Solved)
A given sample of ink is a mixture of red dye, blue dye and orange dye. The blue dye is least absorbed than the rest and the red dye is most sticky.
(a) Complete the paper chromatogram below showing their separation.
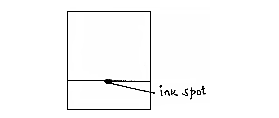
(b) The above dyes are soluble in water. Describe how a pure sample of blue dye can be obtained.
(c) Name the solvent used in paper chromatography.
Date posted:
September 13, 2019
.
Answers (1)
-
The set up below was used to prepare a hydrocarbon.
(Solved)
The set up below was used to prepare a hydrocarbon.
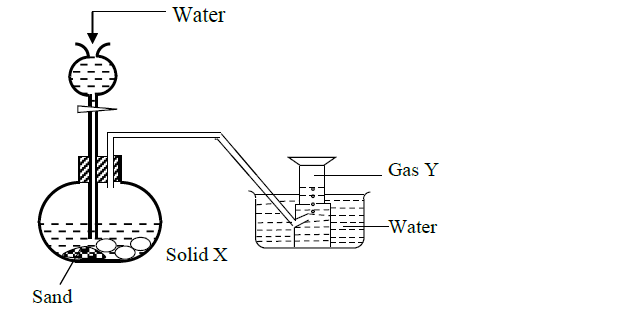
(a) Name solid X
(b) Give a reason why sand is placed at the bottom of the flask.
(c) Write a balanced equation for the reaction taking place in the flask.
Date posted:
September 13, 2019
.
Answers (1)
-
The sketch of the graph below shows a reaction between magnesium ribbon and dilute hydrochloric acid.
(Solved)
The sketch of the graph below shows a reaction between magnesium ribbon and dilute hydrochloric acid.
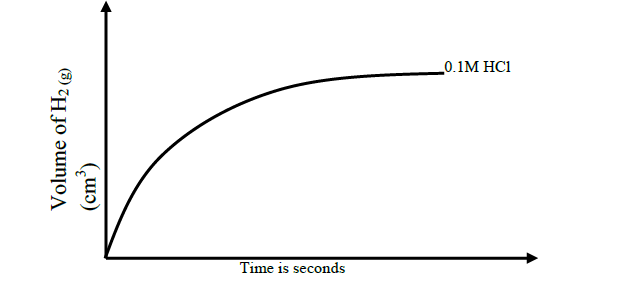
(a) On the graph indicate the curve for 0.05M HCl
(b) Other than change in concentration, name two other factors that can affect the rate of reaction above.
Date posted:
September 13, 2019
.
Answers (1)
-
Study the flow chart below carefully.
(Solved)
Study the flow chart below carefully.
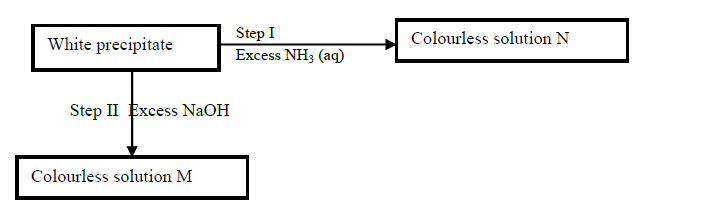
(a) Identify the cat-ion in the colourless solution N.
(b) Write ionic equations for the reactions in Step I.
Date posted:
September 13, 2019
.
Answers (1)