-
The figure below shows a circular conductor placed closely to a magnet. When the magnet is moved, a current is induced as shown. Indicate the...
(Solved)
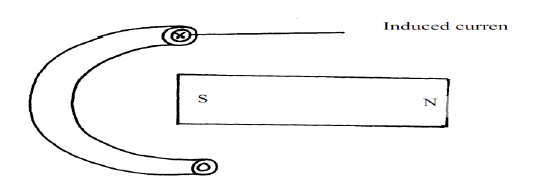
The figure below shows a circular conductor placed closely to a magnet. When the magnet is moved, a current is induced as shown. Indicate the direction of motion of the magnet.
Date posted:
September 26, 2019
.
Answers (1)
-
Calculate the cost of using a electricity iron rated 1200W, for a total of 30hours given that the cost of electricity per KWh is ksh...
(Solved)
Calculate the cost of using a electricity iron rated 1200W, for a total of 30hours given that the cost of electricity per KWh is ksh 8.
Date posted:
September 26, 2019
.
Answers (1)
-
The figure below sow a current carrying conductor passing between two cardboards. Show the direction of the deflection on each compass on the cardboard.
(Solved)
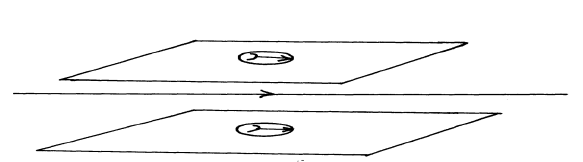
The figure below sow a current carrying conductor passing between two cardboards. Show the direction of the deflection on each compass on the cardboard.
Date posted:
September 26, 2019
.
Answers (1)
-
A stone and a feather are dropped from rest from a building 20m tall. If they reach the ground at the same time, find.
(a) The...
(Solved)
A stone and a feather are dropped from rest from a building 20m tall. If they reach the ground at the same time, find.
(a) The velocity with which they reach the ground. (Take g=l0m/s2)
(b) The condition under which they fall.
Date posted:
September 26, 2019
.
Answers (1)
-
Find the velocity ratio of the following gear wheels.
(Solved)
Find the velocity ratio of the following gear wheels.

Date posted:
September 26, 2019
.
Answers (1)
-
The diagram below shows a metal tube made of iron and copper. The joint is tight at room temperature.
(Solved)
The diagram below shows a metal tube made of iron and copper. The joint is tight at room temperature.
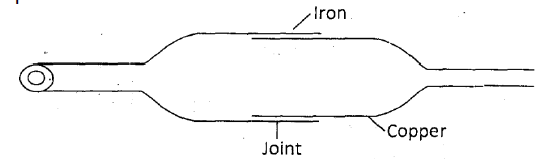
Explain how you would separate the two by changing the temperature given that copper expands more than iron for some change in temperature.
Date posted:
September 26, 2019
.
Answers (1)
-
A student used the measuring instrument shown below to measure the thickness of a cylindrical wire, If the wire is 10cm long, find the volume...
(Solved)
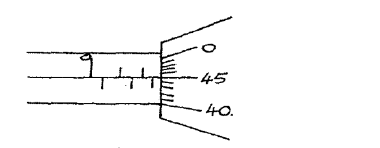
A student used the measuring instrument shown below to measure the thickness of a cylindrical wire, If the wire is 10cm long, find the volume of the wire.
Date posted:
September 26, 2019
.
Answers (1)
-
A lorry weighing 6400kg is lifted with a jack screw of 11mm pitch. If the handle is 28cm from the screw
(Solved)
A lorry weighing 6400kg is lifted with a jack screw of 11mm pitch. If the handle is 28cm from the screw
(i) Find the velocity ratio
(ii) Neglecting the frictional force, Calculate mechanical advantage, MA)
(iii) Determine the force applied
Date posted:
September 26, 2019
.
Answers (1)
-
Sometimes work is not done even if there is an applied force. Give a reason
(Solved)
Sometimes work is not done even if there is an applied force. Give a reason
Date posted:
September 26, 2019
.
Answers (1)
-
A stone of mass 40g is tied to the end of a string 50cm long and whirled in a vertical circle of 2 revolutions per...
(Solved)
A stone of mass 40g is tied to the end of a string 50cm long and whirled in a vertical circle of 2 revolutions per second. Calculate the maximum tension in the string
Date posted:
September 26, 2019
.
Answers (1)
-
A particle moving along a circular path of radius 3.0cm describes an arc of length 2cm every second. Determine
(Solved)
A particle moving along a circular path of radius 3.0cm describes an arc of length 2cm every second. Determine
I. Its angular velocity, W
II. Its periodic time, T
Date posted:
September 26, 2019
.
Answers (1)
-
The figure below shows a body being pulled by a constant force of 10N for a distance of 4m over wooden surface. The co-efficient of...
(Solved)
The figure below shows a body being pulled by a constant force of 10N for a distance of 4m over wooden surface. The co-efficient of friction is 0.03
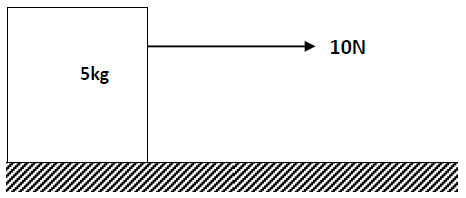
Find the
(i) Acceleration of the body
(ii) Velocity of the body after the 4 metres
(iii) Kinetic energy of the body after the 4 metres
Date posted:
September 26, 2019
.
Answers (1)
-
The figure below shows parts A and B of a glass tube.
(Solved)
The figure below shows parts A and B of a glass tube.
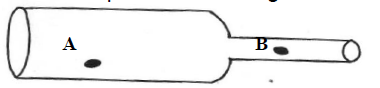
(i) State the part of the tube in which the pressure will be lowest when air is blown through the tube to from A to B
(ii) Compare the velocity of air at A and at B
(iii) What is the relationship between the velocity of the air and its pressure at any point along the tube AB
Date posted:
September 26, 2019
.
Answers (1)
-
a).In an experiment to estimate the diameter of an oil molecule, an oil drop of diameter 0.06cm spread over a circular patch whose diameter is...
(Solved)
a).In an experiment to estimate the diameter of an oil molecule, an oil drop of diameter 0.06cm spread over a circular patch whose diameter is 20cm. Determine
(i) The volume of the oil drop
(ii) The area of the patch covered by oil
(iii) The diameter of the oil molecule
(b) State any one assumption made in a (iii) above
Date posted:
September 26, 2019
.
Answers (1)
-
The figure below shows the apparatus used to examine the pressure of a gas.
(Solved)
The figure below shows the apparatus used to examine the pressure of a gas.
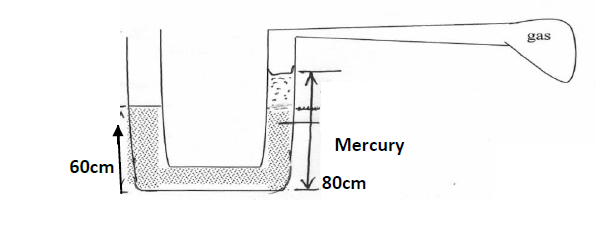
Taking density of mercury to be 13,600kg/m3 and standard atmospheric pressure 100,000N/m2. Calculate gas pressure
Date posted:
September 26, 2019
.
Answers (1)
-
The figure below shows some forces acting on object.
(Solved)
The figure below shows some forces acting on object.
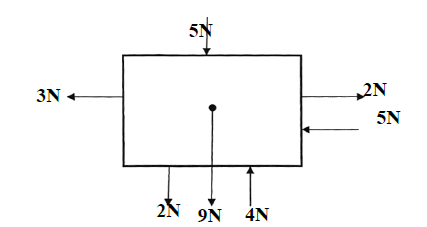
On the figure below draw the resultant force acting on the object.

Date posted:
September 26, 2019
.
Answers (1)
-
A packer pen was accidentally dropped into a measuring cylinder containing water. The volume of water moved from initial level to form the level as...
(Solved)
A packer pen was accidentally dropped into a measuring cylinder containing water. The volume of water moved from initial level to form the level as shown below;-
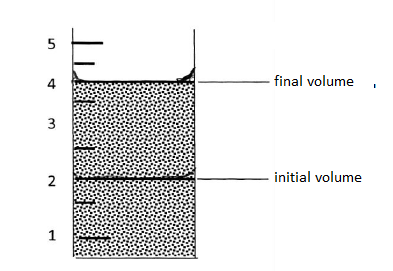
If the mass of the packer pen is 0.012kg determine its density
Date posted:
September 26, 2019
.
Answers (1)
-
An x-ray tube operating at a potential difference of 50KV has a tube current 20mA.Calculate.
(Solved)
An x-ray tube operating at a potential difference of 50KV has a tube current 20mA.Calculate.
i) The electric power input.
ii) The number of electrons hitting the target per second given that e = 1.6 x 10⁻¹⁹.
iii) The velocity of electrons when they hit the target.
Date posted:
September 26, 2019
.
Answers (1)
-
Calculate the maximum velocity of electrons that would produce x-rays of frequency 8.0x10⁸HZ if only 20% of kinetic energy is converted to x – rays.(Take...
(Solved)
Calculate the maximum velocity of electrons that would produce x-rays of frequency 8.0x10⁸HZ if only 20% of kinetic energy is converted to x – rays.(Take planks constant = 6.63 x 10⁻³⁴ JS and mass of electron = 9.1 x 10⁻³¹ kg).
Date posted:
September 26, 2019
.
Answers (1)
-
List two uses of the graphite used in the T.V set.
(Solved)
List two uses of the graphite used in the T.V set.
Date posted:
September 26, 2019
.
Answers (1)