Zone A- For each additional unit of input applied, the output increases because inputs are under utilized.
Zone B- For each additional unit of input, output increases at a slower rate because inputs are maximally utilized.
Zone C- For each additional unit of input applied, the output decreases because the inputs are over utilized.
Kavungya answered the question on October 17, 2019 at 08:56
-
Give two practices that are commonly used in hardening seedlings in a kales nursery.
(Solved)
Give two practices that are commonly used in hardening seedlings in a kales nursery.
Date posted:
October 17, 2019
.
Answers (1)
-
A farmer has the option of growing either wheat or maize in his one hectare land. Wheat gives a return of Kshs. 20, 000 while maize...
(Solved)
A farmer has the option of growing either wheat or maize in his one hectare land. Wheat gives a return of Kshs. 20, 000 while maize gives a return of Kshs. 35, 000. What will be the opportunity cost.
Date posted:
October 17, 2019
.
Answers (1)
-
State two reasons for placing sugar syrup close to beehive.
(Solved)
State two reasons for placing sugar syrup close to beehive.
Date posted:
October 9, 2019
.
Answers (1)
-
State two reasons why it is necessary to have individual calf pens instead of communal calf pens.
(Solved)
State two reasons why it is necessary to have individual calf pens instead of communal calf pens.
Date posted:
October 9, 2019
.
Answers (1)
-
Give five factors that determine spacing of cabbages in the field.
(Solved)
Give five factors that determine spacing of cabbages in the field.
Date posted:
October 9, 2019
.
Answers (1)
-
Given that a crop of cabbage is planted at a spacing of 60cm × 60cm, calculate the plant
population in a plot of land measuring...
(Solved)
Given that a crop of cabbage is planted at a spacing of 60cm × 60cm, calculate the plant
population in a plot of land measuring 4m × 3m. (show your working).
Date posted:
October 9, 2019
.
Answers (1)
-
Describe precautions taken during the harvesting of coffee.
(Solved)
Describe precautions taken during the harvesting of coffee.
Date posted:
October 9, 2019
.
Answers (1)
-
The inventory of Kembo farm as at 31st Dec, 2013 was as follows:
Cash at hand 7,000
Layers ...
(Solved)
The inventory of Kembo farm as at 31st Dec, 2013 was as follows:
Cash at hand 7,000
Layers 25,000
Dairy cattle 130,000
Cassava in store 5,000
Calves 19,000
Buildings 80,000
Land 180,000
Machinery 85,000
On the same day, the following information was obtained from the farmers’ records.
Bank loan 210,000
Egg sale on credit 10,000
Vegetable sales on credit 5,000
Farm input purchased on credit 20,000
Wages payable 6,200
Interest payable 2500
Taxes payable 800
Milk sales on credit 15,000
Prepare a balance sheet
Date posted:
October 9, 2019
.
Answers (1)
-
Why were settlement schemes were established soon after independence?
(Solved)
Why were settlement schemes were established soon after independence?
Date posted:
October 9, 2019
.
Answers (1)
-
State the reasons for imposing quarantine on imported planting materials.
(Solved)
State the reasons for imposing quarantine on imported planting materials.
Date posted:
October 9, 2019
.
Answers (1)
-
State ways on how leaching leads to loss of fertility.
(Solved)
State ways on how leaching leads to loss of fertility.
Date posted:
October 9, 2019
.
Answers (1)
-
The Following weeds were found growing on a maize farm by a form four student. Study the weeds and answer the questions that follow.
(Solved)
The Following weeds were found growing on a maize farm by a form four student. Study the weeds and answer the questions that follow.
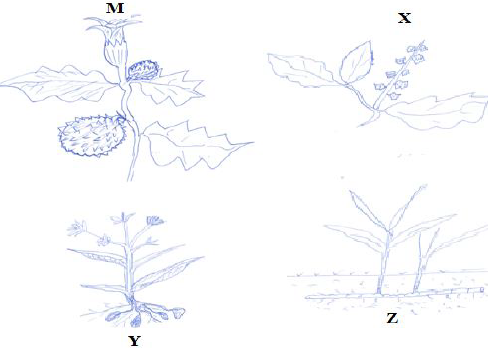
a) Name the weeds labeled X, Y and Z above.
b) State one reason that makes each of the following weeds difficult to control.
(i) X
(ii) Z
c) State one reason why the weed labeled M should not be allowed to grow in the farm
c) State one reason why the weed labeled M should not be allowed to grow in the farm.
Date posted:
October 9, 2019
.
Answers (1)
-
Study the diagram below and answer the questions that follow.
(Solved)
Study the diagram below and answer the questions that follow.
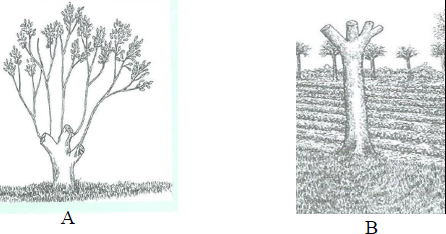
a) Identify the three harvesting methods shown in the diagrams above.
b) Name four sites for agroforestry trees in the farm.
Date posted:
October 9, 2019
.
Answers (1)
-
Patricia was advised to plant her maize crop at a spacing of 90 x 30cm. calculate the plant population if her plot measures 93m...
(Solved)
Patricia was advised to plant her maize crop at a spacing of 90 x 30cm. calculate the plant population if her plot measures 93m x 42 m.
Date posted:
October 7, 2019
.
Answers (1)
-
State three methods of weed control in paddy rice.
(Solved)
State three methods of weed control in paddy rice.
Date posted:
October 7, 2019
.
Answers (1)
-
State three materials used to prepare rooting mixture to fill polythene sleeves
(Solved)
State three materials used to prepare rooting mixture to fill polythene sleeves
Date posted:
October 7, 2019
.
Answers (1)
-
Distinguish between minimum tillage and sub-soiling as used in agricultural production
(Solved)
Distinguish between minimum tillage and sub-soiling as used in agricultural production
Date posted:
October 7, 2019
.
Answers (1)
-
Study the following information which was extracted from Mr. Chacha’s farm record on 31- 12-2013 and answer the questions below.
Loans payable to bank Kshs. 300,000
Five...
(Solved)
Study the following information which was extracted from Mr. Chacha’s farm record on 31- 12-2013 and answer the questions below.
Loans payable to bank Kshs. 300,000
Five milking cows Ksh 250,000
400 layers Kshs. 80,000
20 goat Kshs. 30,000
Debts payable to co-operative Ksh 20,000
Buildings and structures kshs. 600,000
Bonus payable to workers Ksh 19,000
Cattle feed in store Kshs. 10,000
Animal drugs in store Kshs 4,000
Debts receivable Kshs. 18,000
Breakages to repair Kshs. 30,000
Cash at hand Kshs. 20,000
Cash in bank Kshs. 30,000
Spray equipment Kshs. 12,000
(i) Prepare a balance sheet for Chacha’s farm using the information above.
(ii) Was the business solvent or insolvent?
Date posted:
October 4, 2019
.
Answers (1)
-
Differentiate between net revenue and marginal revenue.
(Solved)
Differentiate between net revenue and marginal revenue.
Date posted:
October 4, 2019
.
Answers (1)
-
Explain six reasons for pruning coffee
(Solved)
Explain six reasons for pruning coffee
Date posted:
October 4, 2019
.
Answers (1)