-
The figure below is a cuboid in which PQ = 8cm, QR =12cm and CR = 4cm. M and N are midpoints of QR and...
(Solved)
The figure below is a cuboid in which PQ = 8cm, QR =12cm and CR = 4cm. M and N are midpoints of QR and AD respectively
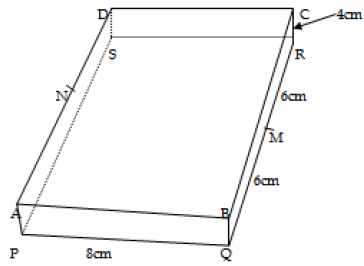
a) Find the length of
i) SM
ii) CM
b) Calculate the angle the line:
i) DM makes with the plane PQRS
ii) DM makes with the plane BQRC
iii) Angle ABM
Date posted:
November 15, 2019
.
Answers (1)
-
The income tax rates in a certain year are as shown below.
Omar pays sh. 4000 as PAYE per month. He has a monthly house allowance...
(Solved)
The income tax rates in a certain year are as shown below.
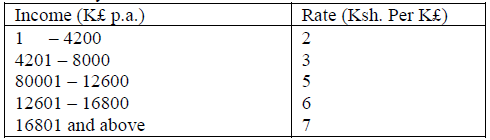
Omar pays sh. 4000 as PAYE per month. He has a monthly house allowance of Ksh. 10800 and is entitled to a personal relief of Ksh. 1200 per month. Determine
i) His gross tax per annum in Ksh.
ii) His taxable income in K£ per annum
iii) His basic salary in Ksh. Per month
iv) His net salary per month
Date posted:
November 15, 2019
.
Answers (1)
-
Draw a line AB=4cm, P is a variable point in the plane of the paper, above AB, such that angle APB=60° and the area of...
(Solved)
Draw a line AB=4cm, P is a variable point in the plane of the paper, above AB, such that angle APB=60° and the area of triangle APB = 6cm2. Using a ruler and a pair of compasses only find the locus of P.
Date posted:
November 15, 2019
.
Answers (1)
-
Solve for x in the equation
2Sin2x-1= Cos2x+ Sin x where 00= x = 3600.
(Solved)
Solve for x in the equation
2Sin2x-1= Cos2x+ Sin x where 00≤ x ≤ 3600.
Date posted:
November 15, 2019
.
Answers (1)
-
The coordinate of the end point of the diameter of a circle are A(3, -2) and B(5, 1). Find the equation of a circle in...
(Solved)
The coordinate of the end point of the diameter of a circle are A(3, -2) and B(5, 1). Find the equation of a circle in the form ax2 + by2+ cx + dy + e = 0
Date posted:
November 15, 2019
.
Answers (1)
-
Solve for x
(Log3x)2- 1/2Log3x=3/2.
(Solved)
Solve for x
(Log3x)2- 1/2Log3x=3/2.
Date posted:
November 15, 2019
.
Answers (1)
-
Two places R and T are on the same circle of latitude North of the equator. The longitude of R is 118°W and longitude of...
(Solved)
Two places R and T are on the same circle of latitude North of the equator. The longitude of R is 118°W and longitude of T is 133°E. The shortest distance between R and T measured along the circle of latitude is 5422 nautical miles. Find to the nearest degree the latitude on which R and T lie.
Date posted:
November 15, 2019
.
Answers (1)
-
The length and breadth of a rectangular flower garden were measured and found to be 4.1m and 2.2m respectively. Find the percentage error in its...
(Solved)
The length and breadth of a rectangular flower garden were measured and found to be 4.1m and 2.2m respectively. Find the percentage error in its area.
Date posted:
November 15, 2019
.
Answers (1)
-
Find a quadratic equation where roots are 1.5 + v2 and 1.5 - v2, expressing it in the form ax2 + bx + c =...
(Solved)
Find a quadratic equation where roots are 1.5 + √2 and 1.5 - √2, expressing it in the form ax2 + bx + c = 0, where a, b and c are integers.
Date posted:
November 15, 2019
.
Answers (1)
-
a) A straight line L1 whose equation is 3y – 2x = -2 meets the x –axis at R. Determine the coordinates of R
b)...
(Solved)
a) A straight line L1 whose equation is 3y – 2x = -2 meets the x –axis at R. Determine the coordinates of R
b) A second line L2 is perpendicular to L1 at R. Find the equation of L2 in the form y = mx + c, where m and c are constants
c) A third line L3 passes through (-4, 1) and is parallel to L1, find
i) The equation of L3 in the form y=mx+c, where m and c are constants
iii) The coordinates of point S at which L3 intersects L2
Date posted:
November 15, 2019
.
Answers (1)
-
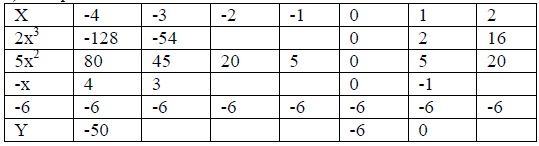
Complete the table below for the function Y = 2x3 + 5x2 – x– 6.
(Solved)
Complete the table below for the function Y = 2x3 + 5x2 – x– 6.
Date posted:
November 15, 2019
.
Answers (1)
-
The frequency table below shows the daily wages paid to casual workers by a certain company.
a) Draw a histogram to represent the above information above...
(Solved)
The frequency table below shows the daily wages paid to casual workers by a certain company.

a) Draw a histogram to represent the above information above
b) i) State the class in which the median wage lies
ii) Draw a vertical line in the diagram showing where the median wage lies
c) Using the histogram, determine the number of workers who earn sh. 450 or less per day.
Date posted:
November 15, 2019
.
Answers (1)
-
In a triangle ABC, BC=8cm, AC=12cm and angle ABC=120°
a) Calculate the length of AB, correct to one decimal place
b) If BC is the base...
(Solved)
In a triangle ABC, BC=8cm, AC=12cm and angle ABC=120°
a) Calculate the length of AB, correct to one decimal place
b) If BC is the base of the triangle, calculate correct to one decimal place
i. The perpendicular height of the triangle
ii. The area of the triangle
iii. The size of angle ACB
Date posted:
November 15, 2019
.
Answers (1)
-
A straight line passes through the point (-3, -4) and is perpendicular to the line where equation is 3x + 2y = 11 and intersects...
(Solved)
A straight line passes through the point (-3, -4) and is perpendicular to the line where equation is 3x + 2y = 11 and intersects the x-axis and y-axis at points A and B respectively. Find the length AB.
Date posted:
November 15, 2019
.
Answers (1)
-
Expand and simplify the expression (2x2 – 3y3)2 + 12x2y3.
(Solved)
Expand and simplify the expression (2x2 – 3y3)2 + 12x2y3.
Date posted:
November 15, 2019
.
Answers (1)
-
Given that Cos(x -20)° = Sin(2x + 32)° and x is an acute angle, find Tan (x – 4)°.
(Solved)
Given that Cos(x -20)° = Sin(2x + 32)° and x is an acute angle, find Tan (x – 4)°.
Date posted:
November 15, 2019
.
Answers (1)
-
Given that Log a = 0.30 and Log b = 0.48: find the value of Log b2/a.
(Solved)
Given that Log a = 0.30 and Log b = 0.48: find the value of Log b2/a.
Date posted:
November 15, 2019
.
Answers (1)
-
(a) Using mid - ordinate rule, estimate the area under the curve y = x2 – 2, using six strips between x =2 , x...
(Solved)
(a) Using mid - ordinate rule, estimate the area under the curve y = x2 – 2, using six strips between x =2 , x = 8 and x-axis
(b) (i) Use integration to determine the exact area under the curve.
(ii) find the percentage error in calculating the area using the mid – ordinate rule.
Date posted:
November 15, 2019
.
Answers (1)
-
The 1st , 7th, and 25th terms of an arithmetic progression are the first three consecutive terms of a geometrical progression. The 20th term of...
(Solved)
The 1st , 7th, and 25th terms of an arithmetic progression are the first three consecutive terms of a geometrical progression. The 20th term of the arithmetic progression is 22. Find:
1.(i) The first term and the common difference of the arithmetic progression.
(ii) The sum of the first 20 terms of the arithmetic progression.
2.(i) The 7th term of the geometric progression.
(ii) the sum of the first six terms of them geometric progression.
Date posted:
November 15, 2019
.
Answers (1)
-
A curve whose gradient function is dy/dx = 3x2 +10x +3 passes through point (-2, -3)
a) Find the equation of the curve
b) i) Determine...
(Solved)
A curve whose gradient function is dy/dx = 3x2 +10x +3 passes through point (-2, -3)
a) Find the equation of the curve
b) i) Determine the turning points
ii) Sketch the curve
Date posted:
November 14, 2019
.
Answers (1)