-
The table below shows marks obtained by 60 form four students in an English test.
(a) State the modal class
(b) Using an assumed mean of...
(Solved)
The table below shows marks obtained by 60 form four students in an English test.
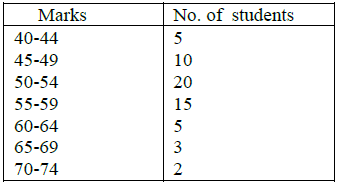
(a) State the modal class
(b) Using an assumed mean of 52,
Calculate:
(i) The actual mean
(ii) The standard deviation
(c) Estimate the median mark
Date posted:
November 20, 2019
.
Answers (1)
-
In a second year class of a certain college, 2/3 are boys and the rest are girls. 4/5 of the boys and 9/10 of the...
(Solved)
In a second year class of a certain college, 2/3 are boys and the rest are girls. 4/5 of the boys and 9/10 of the girls are right handed ,the rest are left handed. The probability that a right handed students will answer a question correctly is 1/10 and the corresponding probability for a left handed students is 3/10 irrespective of the sex.
(a) Draw a tree diagram to represent the above information
(b) Determine:
i) The probability that a student chosen at random from the class is left hand
ii) The student is a girl and answers the questions incorrectly
iii) The probability that a question is answered correctly
Date posted:
November 20, 2019
.
Answers (1)
-
a) Complete the table below for y = x3 + 2x2 - 5x - 4
b) On the grid provided, draw the graph of y =...
(Solved)
a) Complete the table below for y = x3 + 2x2 - 5x - 4

b) On the grid provided, draw the graph of y = x3 + 2x2 - 5x - 4 for -4 ≤ x ≤3. Use 2cm to represent 1 unit on the x axis and 1cm to represent 5 units on the y axis
c) i) Use the equation to solve the equation x3 + 2x2 - 5x - 4 = 0
ii) By drawing a suitable straight line on the graph, solve the equation x3 + 2x2 - 2x - 10 = 0
Date posted:
November 20, 2019
.
Answers (1)
-
The table below shows the income tax rates in a certain year.
Mrs.Masau earned a basic salary of ksh18600 per month and allowances amounting to ksh...
(Solved)
The table below shows the income tax rates in a certain year.
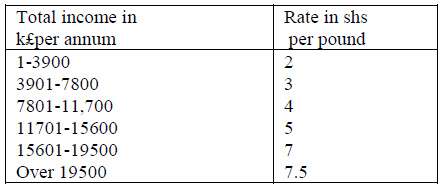
Mrs.Masau earned a basic salary of ksh18600 per month and allowances amounting to ksh 7800 per month. She claimed a personal relief of ksh 1080 per month.
Calculate:
a) Total taxable income in k£ p.a
b) i) the tax payable in ksh per month without relief
ii)the tax payable in ksh per month after relief
c) Mrs. Musau’s net monthly income
Date posted:
November 20, 2019
.
Answers (1)
-
Find y given that is a singular matrix.
(Solved)
Find y given that  is a singular matrix.
Date posted:
November 20, 2019
.
Answers (1)
-
Evaluate
(Solved)
Evaluate 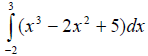
Date posted:
November 20, 2019
.
Answers (1)
-
a) Expand and simplify the expression (1+2x)6.
b) Use the first four terms of the expression in (a) above to find the approximate value of (1.02)6.
(Solved)
a) Expand and simplify the expression (1+2x)6.
b) Use the first four terms of the expression in (a) above to find the approximate value of (1.02)6.
Date posted:
November 20, 2019
.
Answers (1)
-
A two digit number is such that the product of its tens and ones is 56.When the digits are reversed the number formed exceeds the...
(Solved)
A two digit number is such that the product of its tens and ones is 56.When the digits are reversed the number formed exceeds the original number by 9. Find the number.
Date posted:
November 20, 2019
.
Answers (1)
-
Two taps P and Q can fill a cistern in 6 minutes and 4 minutes respectively. Another tap R can drain the same cistern in...
(Solved)
Two taps P and Q can fill a cistern in 6 minutes and 4 minutes respectively. Another tap R can drain the same cistern in 8 minutes. Tap Q and R are opened for 2 minutes and then tap P is opened. Find the time taken to fill the cistern.
Date posted:
November 20, 2019
.
Answers (1)
-
The area of a sector of a circle of radius 15cm is 270cm2 .If the area of the sector subtends
an angle Ø at the centre...
(Solved)
The area of a sector of a circle of radius 15cm is 270cm2 .If the area of the sector subtends
an angle Ø at the centre of the circle, calculate: Use π= 22/7
a) The size of angle Ø in radians
b) The length of the arc subtended by the angle Ø
Date posted:
November 20, 2019
.
Answers (1)
-
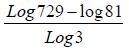
Without using tables or calculator evaluate
(Solved)
Without using tables or calculator evaluate
Date posted:
November 20, 2019
.
Answers (1)
-
During the 1998 Safari rally, our local driver Patrick Njiru covered 550km in 2hours.Find the percentage error in his speed.
(Solved)
During the 1998 Safari rally, our local driver Patrick Njiru covered 550km in 2hours.Find the percentage error in his speed.
Date posted:
November 20, 2019
.
Answers (1)
-
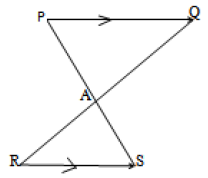
In the figure below PQ is parallel to RS. PS and QR intersect at A. Given that PQ=9cm, RS=3cm and AS=4cm, calculate the length of...
(Solved)
In the figure below PQ is parallel to RS. PS and QR intersect at A. Given that PQ=9cm, RS=3cm and AS=4cm, calculate the length of PS.
Date posted:
November 20, 2019
.
Answers (1)
-
Make V the subject of the formula
Mgh - 1/2 mV2 = 1
(Solved)
Make V the subject of the formula
Mgh - 1/2 mV2 = 1
Date posted:
November 20, 2019
.
Answers (1)
-
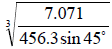
Use logarithm, correct to 4 decimal places to evaluate
(Solved)
Use logarithm, correct to 4 decimal places to evaluate
Date posted:
November 20, 2019
.
Answers (1)
-
In the diagram below ABE is a tangent to a circle at B and DCE is a straight line.
If o, o...
(Solved)
In the diagram below ABE is a tangent to a circle at B and DCE is a straight line.
If o, o and O is the centre of the circle.
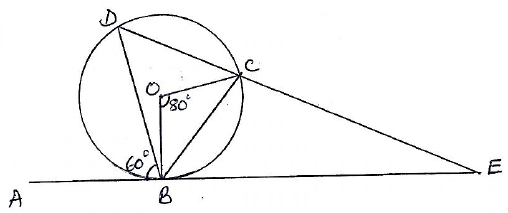
Find the value of
Date posted:
November 20, 2019
.
Answers (1)
-
Elvis exchanged Ksh.600,000 to Sterling pounds. After settling the bills worth £1200, he changed the balance to Euros. He then purchased goods worthy 200 Euros....
(Solved)
Elvis exchanged Ksh.600,000 to Sterling pounds. After settling the bills worth £1200, he changed the balance to Euros. He then purchased goods worthy 200 Euros. Using the exchange rates below, calculate his balance in Kenyan shillings.
Buying (Ksh) Selling (Ksh)
1 Sterling pound 114.20 114.50
1 Euro 101.20 101.30
Date posted:
November 20, 2019
.
Answers (1)
-
Evaluate
(Solved)
Evaluate 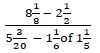
Date posted:
November 20, 2019
.
Answers (1)
-
The positions of three towns on the earth’s surface are given as P (600N, 550W), Q (200S, 550W) S (600N, 1250E) respectively (Take R =...
(Solved)
The positions of three towns on the earth’s surface are given as P (600N, 550W), Q (200S, 550W) S (600N, 1250E) respectively (Take R = 6370km and π = 22/7)
a) Calculate the distance:
i. PQ in nautical miles.
ii. PS along the parallel of latitude in km.
iii. The shortest distance between P and S.
b) A plane leaves town T (840S, 100E) and flies westwards for 6 ½ hrs at a speed of 268 knots and reaches town R (840S, X0). Find the longitude X, give your answer to the nearest degree.
Date posted:
November 20, 2019
.
Answers (1)
-
A transformation whose matrix is maps a quadrilateral ABCD onto another quadrilateral A’B’C’D’ whose area is 540????2. Find the area of the quadrilateral ABCD.
(Solved)
A transformation whose matrix is  maps a quadrilateral ABCD onto another quadrilateral A’B’C’D’ whose area is 540𝑐𝑚2. Find the area of the quadrilateral ABCD.
Date posted:
November 20, 2019
.
Answers (1)