 Get premium membership
 and access questions with answers, video lessons as well as revision papers.
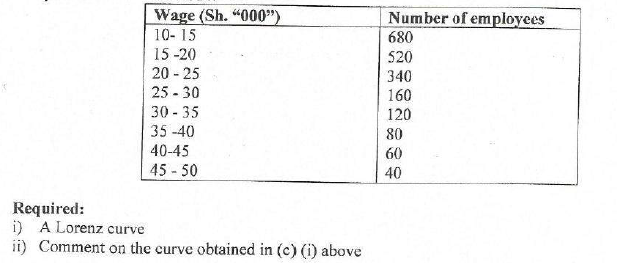
- The data below shoes the distribution of wages earned by employees in a certain company for the year ended 30 June 2014.(Solved)
The data below shoes the distribution of wages earned by employees in a certain company for the year ended 30 June 2014.
Date posted: May 26, 2021. Answers (1)
- Highlight 4 principles that should be observed when constructing graphs.(Solved)
Highlight 4 principles that should be observed when constructing graphs.
Date posted: May 26, 2021. Answers (1)
- Highlight 4 types of biases that could be encountered by a researcher during data collection.(Solved)
Highlight 4 types of biases that could be encountered by a researcher during data collection.
Date posted: May 26, 2021. Answers (1)
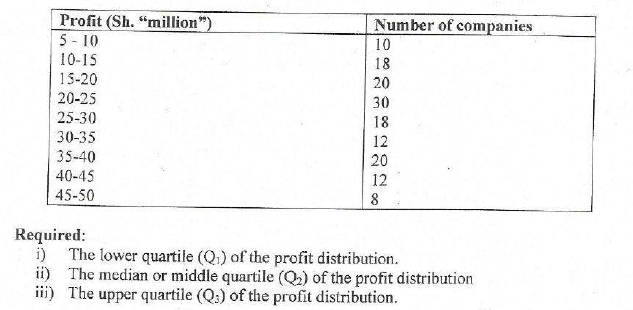
- The following table shows the profit distribution of 150 companies in a given county:(Solved)
The following table shows the profit distribution of 150 companies in a given county:
Date posted: May 26, 2021. Answers (1)
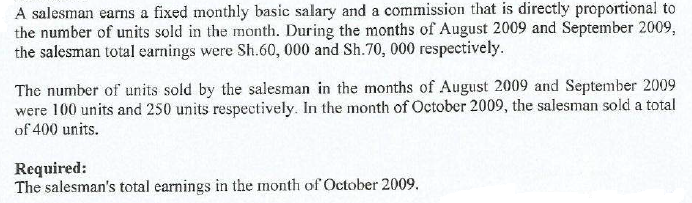
- A salesman earns a fixed monthly basic salary and a commission that is directly proportional to the number of units sold in the month.(Solved)
Date posted: May 26, 2021. Answers (1)
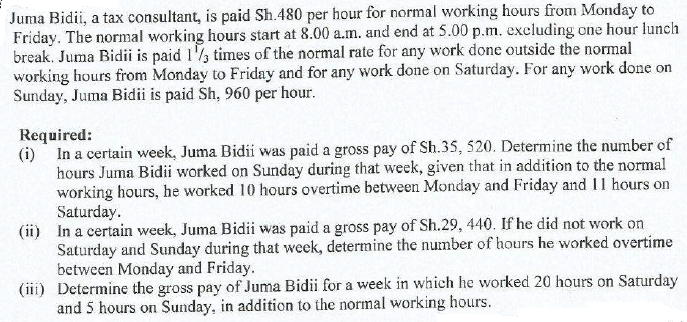
- Juma Bidii, a tax consultant, is paid sh 480 per hour for normal working hours from Monday to Friday.(Solved)
Date posted: May 26, 2021. Answers (1)
- Kimani and Otieno have been trading in partnership since 1 January 2010. The partners' capital account balances as at 1 Jan 2010 were sh 4,500,000...(Solved)
Kimani and Otieno have been trading in partnership since 1 January 2010. The partners' capital account balances as at 1 Jan 2010 were sh 4,500,000 and sh 3,600,000 respectively.
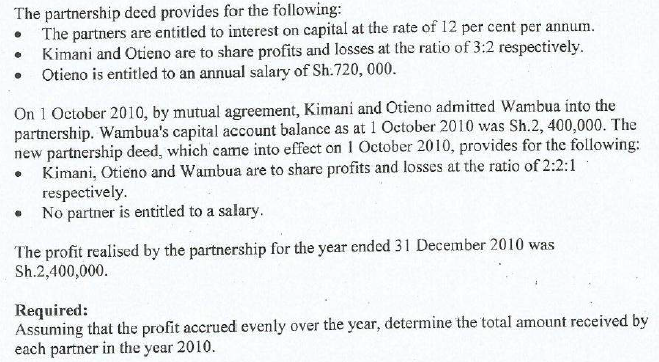
Date posted: May 26, 2021. Answers (1)
- The consumer price indices of a certain country for the years 2008 and 2010, using the year 2000 as the base year were 120 and...(Solved)
The consumer price indices of a certain country for the years 2008 and 2010, using the year 2000 as the base year were 120 and 128 respectively.
The average wages of a unionisable employee in the country for the years 2008 and 2010 were sh 15,000 and 15,900 respectively.
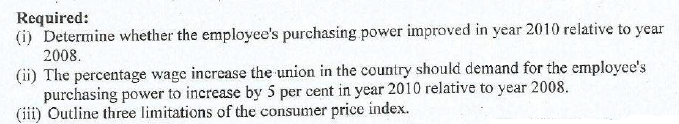
Date posted: May 26, 2021. Answers (1)
- Johnson Piri is employed to sell generators on a salary and commission basis. His fixed monthly salary is sh 105,000.(Solved)
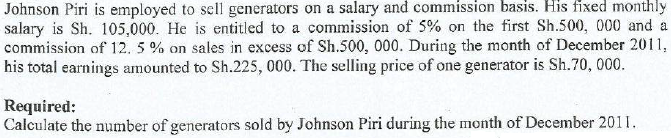
Date posted: May 26, 2021. Answers (1)
- An estate agent receives commission on the sale of property as follows:
5% on the first sh 100,000 on the sale price
3% on the remainder of...(Solved)
An estate agent receives commission on the sale of property as follows:
5% on the first sh 100,000 on the sale price
3% on the remainder of the sale price
Required.
The sale price of the property where the agent receives a total commission of sh 391,000.
Date posted: May 26, 2021. Answers (1)
- Distinguish between a trade discount and a cash discount.(Solved)
Distinguish between a trade discount and a cash discount.
Date posted: May 26, 2021. Answers (1)
- Vincent Yeri purchased 900 oranges at a price of 50 for every 60 oranges. His family consumed 50 of the oranges and 22 oranges were...(Solved)
Vincent Yeri purchased 900 oranges at a price of 50 for every 60 oranges. His family consumed 50 of the oranges and 22 oranges were rotten. He later sold the oranges in dozens.
Required.
The selling price per dozen if he wished to make a total profit of 285.
Date posted: May 26, 2021. Answers (1)
- Joseph Ndumbu, a sales representative, earns a basic monthly salary of 75,000 plus a commission of 5% on sales in excess of sh 200,000. During...(Solved)
Joseph Ndumbu, a sales representative, earns a basic monthly salary of 75,000 plus a commission of 5% on sales in excess of sh 200,000. During the month of march 2014, he sold goods worth sh 480,800. He was also reliable to statutory deductions of 320 NHIF, 400 NSSF, 19,700 loan repayments and 7,500 for mid month salary advance.
Ignore taxes.
Required.
Net pay for Joseph Ndumbu for the month of March 2014.
Date posted: May 26, 2021. Answers (1)
- Differentiate between the following terms
i) Credit card and debit card
ii) Mark-up and margin(Solved)
Differentiate between the following terms
i) Credit card and debit card
ii) Mark-up and margin
Date posted: May 26, 2021. Answers (1)
- Scholastica Mbula intends to purchase a posho mill costing Ksh 344,960 in the year 2012.(Solved)
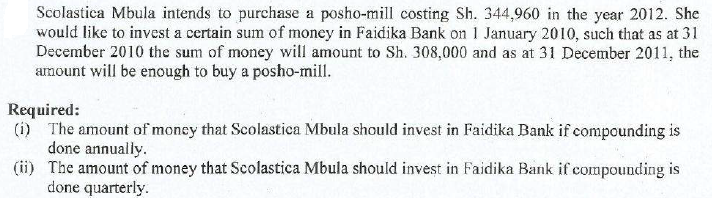
Date posted: May 26, 2021. Answers (1)
- Faulu University College employed an accounting lecturer on 1 Jan 2008. The annual salary of the lecturer in the year 2008 was Ksh 1,400,000.(Solved)
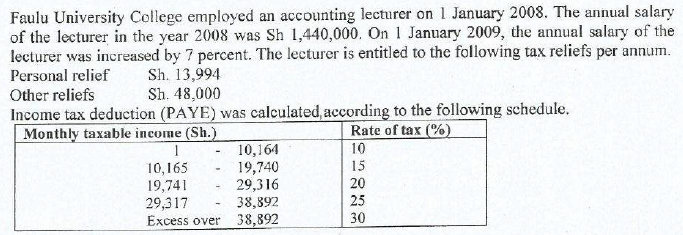
Required.
The percentage increase in the lecturer's net monthly salary for the year 2009.
Date posted: May 26, 2021. Answers (1)
- Mary Ngugi owns a piece of land currently valued at sh 200,000. She intends to dispose the piece of land and and use the proceeds...(Solved)
Mary Ngugi owns a piece of land currently valued at sh 200,000. She intends to dispose the piece of land and and use the proceeds to purchase a pick up currently valued at 1 million. The value of the piece of land appreciates at a fixed rate of 50,000 per annum while the value of the pick up depreciates at the rate of 20 per cent per annum, on a straight line basis.
Required.
The number of years it would take for the value of the piece of land to be equal to the value of the pickup.
Date posted: May 26, 2021. Answers (1)
- Mary Mutiso bought a posho mill on hire purchase terms. The cash price of the posho mill is Sh. 1,200,000. The hire purchase terms comprise...(Solved)
Mary Mutiso bought a posho mill on hire purchase terms. The cash price of the posho mill is Sh. 1,200,000. The hire purchase terms comprise a deposit of 25% of the cash price and 12 equal monthly installments of the balance and interest payable. Simple interest is charged on the principal balance at the rate of 12.5 percent per annum.
Required.
i) The amount of each monthly installment.
ii) The amount of savings (if any) that Mary Mutiso would have made if she had paid a deposit of 45% of the cash price and was charged simple interest of 10% per annum.
Date posted: May 25, 2021. Answers (1)
- Mr Yusuf Said purchased a grinding machine at a cost of Sh 513,000. The estimated useful life of the machine is 10 years with an...(Solved)
Mr Yusuf Said purchased a grinding machine at a cost of Sh 513,000. The estimated useful life of the machine is 10 years with an estimated residual value of sh 10,000.
Required.
i) The annual rate of depreciation using the reducing balance method.
ii) The net book value of the machine at the end of the 4th year.
Date posted: May 25, 2021. Answers (1)
- The following distribution gives the profits realized by 1,000 companies for the year ended 31 December 2010.(Solved)
The following distribution gives the profits realized by 1,000 companies for the year ended 31 December 2010.
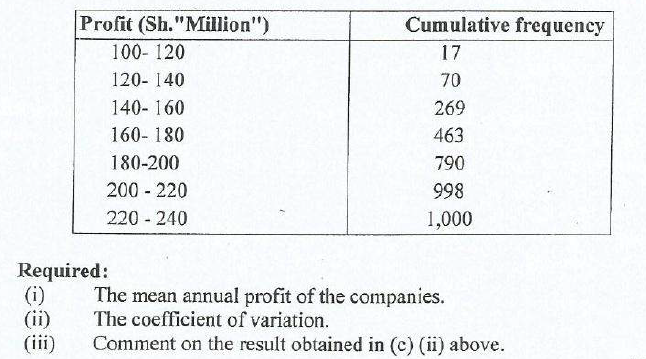
Date posted: May 25, 2021. Answers (1)