-
The table below shows four principal crops produced in Kenya in the years 2000 and 2001.Use it to answer questions.
(Solved)
The table below shows four principal crops produced in Kenya in the years 2000 and 2001.Use it to answer questions.
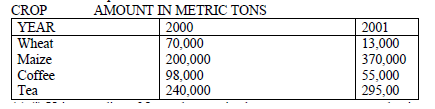
(a) State two advantages of using a pie chart to represent the above information.
(b) Calculate the percentage increase in wheat production between the years 2000 and 2001.
Date posted:
April 17, 2019
.
Answers (1)
-
Study the figure below and use it to answer the questions that follows. The figure depicts proportional
divided circles showing the extend of network coverage in...
(Solved)
Study the figure below and use it to answer the questions that follows. The figure depicts proportional
divided circles showing the extend of network coverage in Kenya between 2007 and 2009
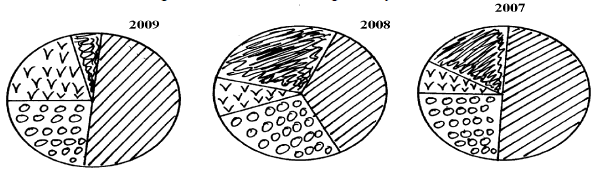
i) State four deductions that can be made from the above representation
ii)State three advantages of using proportional circles in representing data
Date posted:
April 17, 2019
.
Answers (1)
-
The table below shows leading import crops by value (Kshs. Million). Use is to answer
questions a – b
(Solved)
The table below shows leading import crops by value (Kshs. Million). Use is to answer
questions a – b

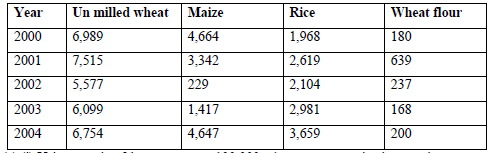
a)Give three advantages of using comparative bar graphs to represent the above information.
(b) Explain three reasons why Kenya is a producer of the commodities shown in the table
above yet she imports the same.
Date posted:
April 17, 2019
.
Answers (1)
-
Study the table below and answer the question that follow:-
(Solved)
Study the table below and answer the question that follow:-
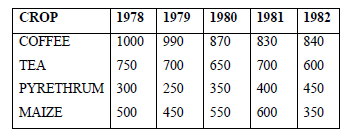
Give two disadvantages of using bar graph method to represent the above statistical data.
Date posted:
April 17, 2019
.
Answers (1)
-
Explain how Continentality influence climate.
(Solved)
Explain how Continentality influence climate.
Date posted:
April 17, 2019
.
Answers (1)
-
The map of Africa below shows the different climatic regions of Africa. Use it to answer
questions below it.
(Solved)
The map of Africa below shows the different climatic regions of Africa. Use it to answer
questions below it.
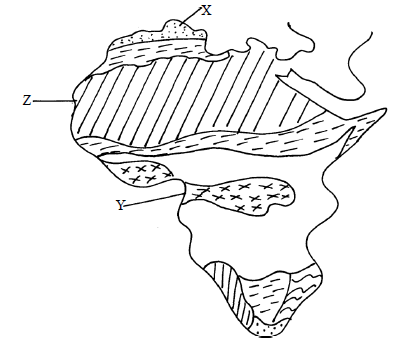
i)Identify the climatic types marked X and Y.
ii)Name any four characteristics of the climate marked Z
Date posted:
April 17, 2019
.
Answers (1)
-
Study the diagram below and name the air masses marked A, B , C and D
(Solved)
Study the diagram below and name the air masses marked A, B , C and D
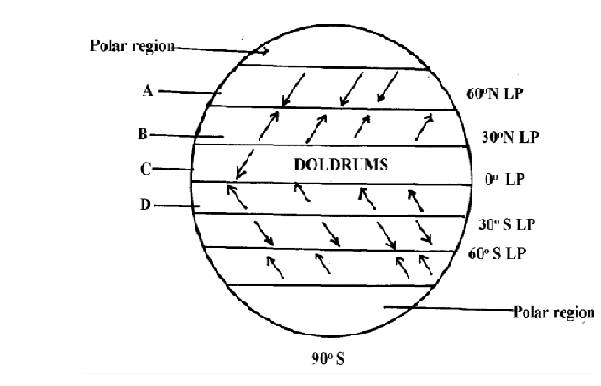
Key
LP- Low Pressure
HP- High Pressure
Date posted:
April 17, 2019
.
Answers (1)
-
The map below shows the climatic regions of Kenya.Use it to answer the question a and b
(Solved)
The map below shows the climatic regions of Kenya.Use it to answer the question a and b
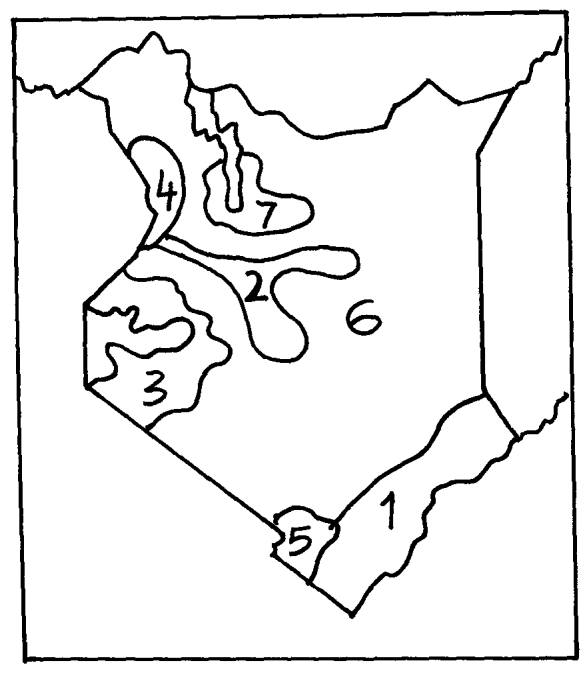
(a) Name the climatic region name 2 and 3
(b) State three characteristics of climatic region marked 7
Date posted:
April 17, 2019
.
Answers (1)
-
State two qualities that makes Stevenson screen suitable for its work
(Solved)
State two qualities that makes Stevenson screen suitable for its work
Date posted:
April 17, 2019
.
Answers (1)
-
Identify with evidence two climatic aspects that could have influenced the distribution
of vegetation
(Solved)
Identify with evidence two climatic aspects that could have influenced the distribution
of vegetation
Date posted:
April 17, 2019
.
Answers (1)
-
Name four Greenhouse gases
(Solved)
Name four Greenhouse gases.
Date posted:
April 17, 2019
.
Answers (1)
-
What is global warming?
(Solved)
What is global warming?
Date posted:
April 17, 2019
.
Answers (1)
-
Account for any four characteristics of tropical rainforests.
(Solved)
Account for any four characteristics of tropical rainforests.
Date posted:
April 17, 2019
.
Answers (1)
-
What is the Inter-tropical convergence Zone?
(Solved)
What is the Inter-tropical convergence Zone?
Date posted:
April 17, 2019
.
Answers (1)
-
Name two weather recording instruments that are placed in a Stevenson’s screen
(Solved)
Name two weather recording instruments that are placed in a Stevenson’s screen
Date posted:
April 17, 2019
.
Answers (1)
-
What do you understand by: (i) Micro- climate (ii) Green house effect
(Solved)
What do you understand by:
i) Micro- climate
ii) Green house effect
Date posted:
April 17, 2019
.
Answers (1)
-
Four classes intend to visit a weather station near your school to study the instruments for measuring weather element:-
(Solved)
Four classes intend to visit a weather station near your school to study the instruments for measuring weather element:-
(i) Describe how you would use a rain gauge to measure rainfall
(ii) Name two instruments you would find inside a Stevenson screen
Date posted:
April 17, 2019
.
Answers (1)
-
State two human causes of climate change.
(Solved)
State two human causes of climate change.
Date posted:
April 17, 2019
.
Answers (1)
-
Describe two characteristics of a mountain climate
(Solved)
Describe two characteristics of a mountain climate
Date posted:
April 17, 2019
.
Answers (1)
-
State two climatic reasons why the government should evict settlers from the Mau forest complex in the Rift valley of Kenya.
(Solved)
State two climatic reasons why the government should evict settlers from the Mau forest complex in the Rift valley of Kenya.
Date posted:
April 17, 2019
.
Answers (1)