i) - The year 2009 recorded the highest network coverage in the country
- The year 2007 held the lowest network coverage and uncovered areas respectively since 2009
- Safaricom network has been the leading in terms of network coverage since 2007 to 2009
- YU network has been the least in terms of network coverage
ii) - Suitable for absolute totals in different periods
- Gives a good visual impression of the totality
- Easy to interpret.
sharon kalunda answered the question on April 17, 2019 at 09:09
-
The map of Africa below shows the different climatic regions of Africa. Use it to answer
questions below it.
(Solved)
The map of Africa below shows the different climatic regions of Africa. Use it to answer
questions below it.
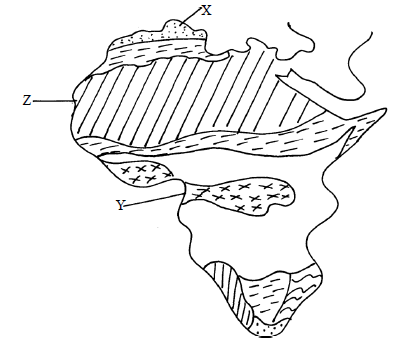
i)Identify the climatic types marked X and Y.
ii)Name any four characteristics of the climate marked Z
Date posted:
April 17, 2019
.
Answers (1)
-
Study the diagram below and name the air masses marked A, B , C and D
(Solved)
Study the diagram below and name the air masses marked A, B , C and D
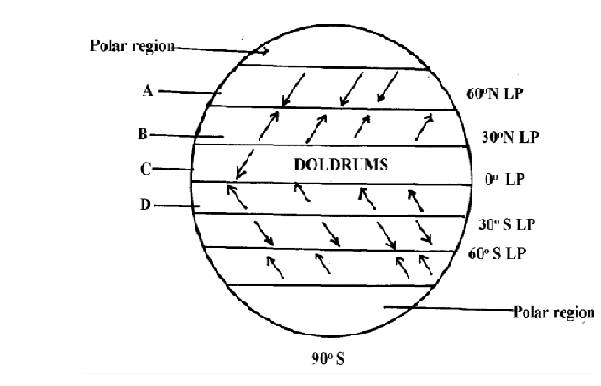
Key
LP- Low Pressure
HP- High Pressure
Date posted:
April 17, 2019
.
Answers (1)
-
The map below shows the climatic regions of Kenya.Use it to answer the question a and b
(Solved)
The map below shows the climatic regions of Kenya.Use it to answer the question a and b
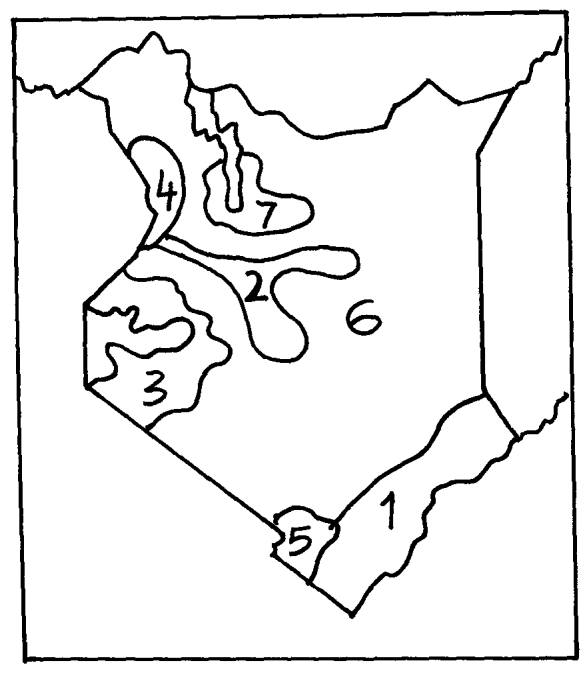
(a) Name the climatic region name 2 and 3
(b) State three characteristics of climatic region marked 7
Date posted:
April 17, 2019
.
Answers (1)
-
State two qualities that makes Stevenson screen suitable for its work
(Solved)
State two qualities that makes Stevenson screen suitable for its work
Date posted:
April 17, 2019
.
Answers (1)
-
Name two weather recording instruments that are placed in a Stevenson’s screen
(Solved)
Name two weather recording instruments that are placed in a Stevenson’s screen
Date posted:
April 17, 2019
.
Answers (1)
-
Describe two characteristics of a mountain climate
(Solved)
Describe two characteristics of a mountain climate
Date posted:
April 17, 2019
.
Answers (1)
-
State two climatic reasons why the government should evict settlers from the Mau forest complex in the Rift valley of Kenya.
(Solved)
State two climatic reasons why the government should evict settlers from the Mau forest complex in the Rift valley of Kenya.
Date posted:
April 17, 2019
.
Answers (1)
-
Describe the climatic conditions experienced in the Kenya highlands
(Solved)
Describe the climatic conditions experienced in the Kenya highlands
Date posted:
April 17, 2019
.
Answers (1)
-
The diagram below represents the internal structure of the earth. Use it to answer question
(Solved)
The diagram below represents the internal structure of the earth. Use it to answer the question that follow.
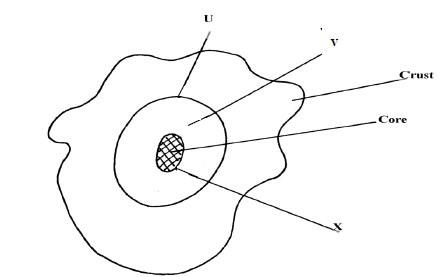
Name the parts named u, v and x.
Date posted:
April 17, 2019
.
Answers (1)
-
Name two equinoxal dates
(Solved)
Name two equinoxal dates
Date posted:
April 17, 2019
.
Answers (1)
-
What is an equinoxal date?
(Solved)
What is an equinoxal date?
Date posted:
April 17, 2019
.
Answers (1)
-
Give two effects of the elliptical shape of the earth
(Solved)
Give two effects of the elliptical shape of the earth
Date posted:
April 17, 2019
.
Answers (1)
-
The diagram below represents an eclipse. Use it to answer the following questions:
(Solved)
The diagram below represents an eclipse. Use it to answer the following questions:
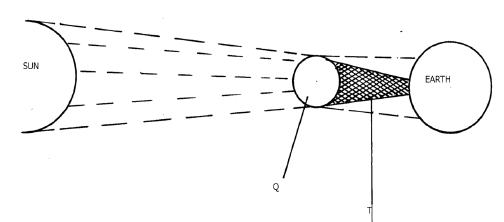
(i) Name the type of eclipse
(ii) Identify the parts marked Q and T
Date posted:
April 17, 2019
.
Answers (1)
-
State any two characteristics of Latitudes.
(Solved)
State any two characteristics of Latitudes.
Date posted:
April 17, 2019
.
Answers (1)
-
Give the reason why the International Date Line is significant.
(Solved)
Give the reason why the International Date Line is significant.
Date posted:
April 17, 2019
.
Answers (1)
-
Name two planets without natural satellites in the solar system
(Solved)
Name two planets without natural satellites in the solar system
Date posted:
April 17, 2019
.
Answers (1)
-
Name two local winds experienced around lake Victoria region.
(Solved)
Name two local winds experienced around lake Victoria region.
Date posted:
April 17, 2019
.
Answers (1)
-
When the local time is 2.00 p.m at longitude 45°E, what is the longitude of a place whose local time is 10.30 a.m
(Solved)
When the local time is 2.00 p.m at longitude 45°E, what is the longitude of a place whose local time is 10.30 a.m
Date posted:
April 17, 2019
.
Answers (1)
-
The diagram below represents the earth on its axis. Use it to answer question
(Solved)
The diagram below represents the earth on its axis. Use it to answer questions that follow
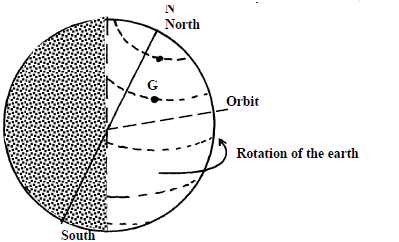
i) Name the latitude marked G
ii) What is the angle of inclination of the earth’s axis from its orbit
Date posted:
April 17, 2019
.
Answers (1)
-
Explain why the study of Geography is beneficial in the management and conservation of the environment.
(Solved)
Explain why the study of Geography is beneficial in the management and conservation of the environment.
Date posted:
April 17, 2019
.
Answers (1)