(i) Increase in temperature increases the rate of enzyme reaction; because increase in temperature increases kinetic energy
causing substrate-enzyme collision
(ii) The rate of reaction is at maximum/best; because enzymes are working at their optimum temperature
(iii) The rate of reaction decreases with increase in temperature; because increase in temperature above optimum denatures
the enzymes.
(iv) PH; substrate concentration; enzyme inhibitors; co-factors and co-enzymes.
sharon kalunda answered the question on May 28, 2019 at 06:38
-
A student in form 3 caught an organism which had the following characteristics.
(i) Body divided into two parts
(ii) Simple eyes
(iii) Eight legs
Classify the organism up...
(Solved)
A student in form 3 caught an organism which had the following characteristics.
(i) Body divided into two parts
(ii) Simple eyes
(iii) Eight legs
Classify the organism up to the class level
Date posted:
May 28, 2019
.
Answers (1)
-
Explain each of the following:
(a) A mature plant cell does not lose its shape even after losing water
(b) Xylem vessels do not collapse even when...
(Solved)
Explain each of the following:
(a) A mature plant cell does not lose its shape even after losing water
(b) Xylem vessels do not collapse even when they are not conducting water
Date posted:
May 28, 2019
.
Answers (1)
-
(i)Identify the mode of feeding of the animal whose dental formula is shown below
(ii) Give reasons for your answer in (i) above
(Solved)
(i)Identify the mode of feeding of the animal whose dental formula is shown below

(ii) Give reasons for your answer in (i) above
Date posted:
May 28, 2019
.
Answers (1)
-
The diagram below represents a cell as seen under an electron microscope.
a) Identify the parts labeled A and D.
b) State the function of the...
(Solved)
The diagram below represents a cell as seen under an electron microscope.
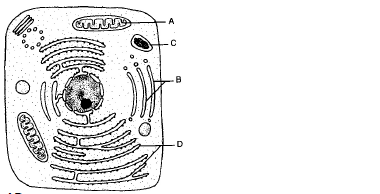
a) Identify the parts labeled A and D.
b) State the function of the structures found on the part labeled D.
Date posted:
May 28, 2019
.
Answers (1)
-
An experiment was carried out to investigate transpiration and absorption of water in sunflower plants in their natural environment with adequate supply of water. The...
(Solved)
An experiment was carried out to investigate transpiration and absorption of water in sunflower plants in their natural environment with adequate supply of water. The amount of water was determined in two hour intervals. The results are shown in the table below.
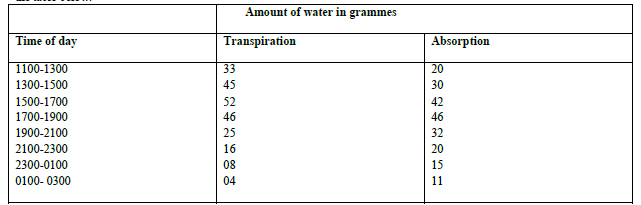
(a) Using the same axes, plot graphs to show transpiration and absorption of water in grammes against time of the day.
(b) At what time of the day was the amount of water the same for transpiration and absorption.
(c) Account for the shape of the graph of
(i) Transpiration
(ii) Absorption
(d) What would happen to transpiration and absorption of water if the experiment was continued till 0050 hours.
(e) Name two factors that may affect transpiration and absorption at any given time.
(f) Explain how the factors you named in (e) above affect transpiration.
Date posted:
May 28, 2019
.
Answers (1)
-
A portion of a nucleic acid is shown below;
a) Name the nucleic acid to which the portion belongs. Give a reason.
b) Write down the...
(Solved)
A portion of a nucleic acid is shown below;
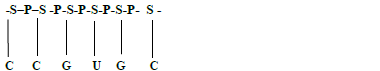
a) Name the nucleic acid to which the portion belongs. Give a reason.
b) Write down the sequence of bases of a complimentary strand to the one above.
Date posted:
May 28, 2019
.
Answers (1)
-
The diagram below illustrate an experiment to demonstrate some aspects of respiration in a potted plant.
(a) Name and state the role of the chemical compound...
(Solved)
The diagram below illustrate an experiment to demonstrate some aspects of respiration in a potted plant.
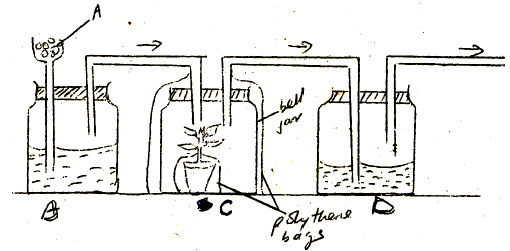
(a) Name and state the role of the chemical compound labeled A
Chemical compound
Role played
(b) What aspect of respiration is being demonstrated?
(c) Name the reagents in set up B and D.
(d) What would be the results in set up B and D after the experiment has run for some time.
Set up B
Set up D
(e) State the importance of covering the bell jar in set up C with a black polythene bag.
(f) Why was it necessary to enclose the pot with a polythene bag.
Date posted:
May 27, 2019
.
Answers (1)
-
Name the cell organelles which would be abundant in
(a) Sperm cell
(b) Pancreas
(Solved)
Name the cell organelles which would be abundant in
(a) Sperm cell
(b) Pancreas
Date posted:
May 27, 2019
.
Answers (1)
-
Define the following terms in reference to fish locomotion
(a) Pitching
(b) Rolling
(c) Yawing
(Solved)
Define the following terms in reference to fish locomotion
(a) Pitching
(b) Rolling
(c) Yawing
Date posted:
May 27, 2019
.
Answers (1)
-
The figure below shows feet of various birds. Study the diagram and answer the questions that follow.
(i) Name the type of evolution represented by the...
(Solved)
The figure below shows feet of various birds. Study the diagram and answer the questions that follow.
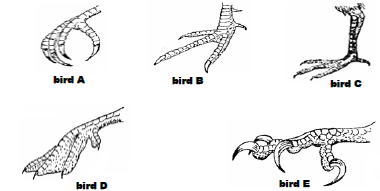
(i) Name the type of evolution represented by the diagrams.
(ii) Using Darwin’s theory of evolution, explain how the feet of bird E would have evolved.
(iii) Explain how Larmack could have explained the evolution of feet of bird C.
Date posted:
May 27, 2019
.
Answers (1)
-
Name the process in the human body that ensures that haemolysis of red blood cells is prevented.
(Solved)
Name the process in the human body that ensures that haemolysis of red blood cells is prevented.
Date posted:
May 27, 2019
.
Answers (1)
-
An experiment was carried out in which red blood cells were put in salt solutions of different concentrations. The table below shows the percentage of...
(Solved)
An experiment was carried out in which red blood cells were put in salt solutions of different concentrations. The table below shows the percentage of cells which were destroyed by haemolysis in different salt concentration.
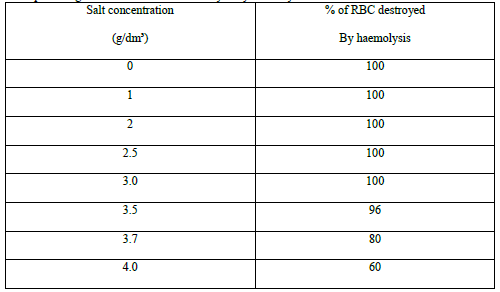

(a) Draw a graph of percentage of red blood cells haemolysed against salt concentration.
(b) Explain haemolysis of red blood cells.
(c) From the graph, state:
(i) the salt concentration at which 50% red blood cells were haemolysed.
(ii) the highest salt concentration when the largest number of red blood cells were haemolysed.
(d) (i) Suggest the normal salt concentration in the blood of the mammal from which the red blood cells were obtained.
(ii) Give a reason for your answer in (d) (i) above.
Date posted:
May 27, 2019
.
Answers (1)
-
A pea plant with smooth seeds was crossed with one with wrinkled seeds. The gene for smooth seeds is dorminant over that for wrinkled seeds....
(Solved)
A pea plant with smooth seeds was crossed with one with wrinkled seeds. The gene for smooth seeds is dorminant over that for wrinkled seeds. Use letter R to represent the dorminant.
(a) State the genotype of the parents if the plant with smooth seeds was heterozygous.
(b) State the gametes produced by the smooth seeds and wrinkled seeds parents.
(c) State the genotype and phenotype of F1 generation. Show your working.
Date posted:
May 27, 2019
.
Answers (1)
-
The diagram below shows a model of the nephron of a mammalian kidney.
(a) Which parts of the nephron are represented by the:
(i) Syringe?
(ii) Perforated rubber...
(Solved)
The diagram below shows a model of the nephron of a mammalian kidney.
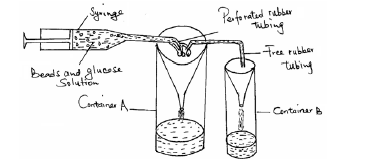
(a) Which parts of the nephron are represented by the:
(i) Syringe?
(ii) Perforated rubber tubing?
(iii) Free rubber tubing?
(b) Name the type of filtration taking place within the perforated rubber tubing.
(c) What would happen to the contents of the syringe if its handle was slowly pushed forward? Explain.
Date posted:
May 27, 2019
.
Answers (1)
-
The picture below shows series of beaks in birds.
a) State the type of evolution that may have led to the emergence of the different beaks...
(Solved)
The picture below shows series of beaks in birds.
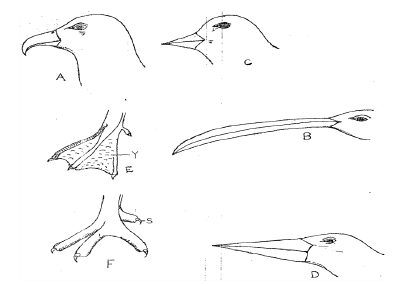
a) State the type of evolution that may have led to the emergence of the different beaks shown on the pictures above.
(b) Name the type of evolution structure represented by the beaks shown on the pictures above.
(c) Observe the pictures carefully. From your observations, what features are responsible for the different types of beaks?
(d) Suggest the type of food likely eaten by birds whose beaks are shown in pictures A, B, C and D.
(e) Briefly state how beak shown in picture A is adapted to feeding.
Date posted:
May 27, 2019
.
Answers (1)
-
In an experiment, lactic acid concentration was measured before, during and after exercise to determine the effect of exercise on the concentration of lactic acid...
(Solved)
In an experiment, lactic acid concentration was measured before, during and after exercise to determine the effect of exercise on the concentration of lactic acid in blood. Study the data obtained and use it to answer the questions that follow.

a) Plot a graph of the concentration of lactic acid against time using a suitable scale. (6 marks)
b) From the graph:
i) Determine the period of exercise.
ii) Explain
c) i) Determine the time when oxygen debt incurred.
ii) Explain
d) i) The duration it took to pay back the oxygen debt
ii) Explain
e) Plot a hypothetical curve for oxygen intake during the experimental period on the same axes.
f) Why does lactic acid level usually continue to rise in the blood after the exercise ceases?
g) State two of effects of lactic acid on tissues.
Date posted:
May 27, 2019
.
Answers (1)
-
The diagram below is a cross section of a portion of alimentary canal.
a) i) Which part of the alimentary canal is represented by the portion...
(Solved)
The diagram below is a cross section of a portion of alimentary canal.

a) i) Which part of the alimentary canal is represented by the portion above.
ii) Give a reason for your answer in (a) (i) above.
b) i) State two functions of the part of alimentary canal represented above.
ii) Explain two structural adaptations of the part of alimentary canal represented above.
Date posted:
May 27, 2019
.
Answers (1)
-
What is the significance of the high tail power in fish locomotion.
(Solved)
What is the significance of the high tail power in fish locomotion.
Date posted:
May 27, 2019
.
Answers (1)
-
The length from tail tip to the anus in a fish is 8cm whereas that from tail tip is 24cm. Calculate the tail power of...
(Solved)
The length from tail tip to the anus in a fish is 8cm whereas that from tail tip is 24cm. Calculate the tail power of the fish.
Date posted:
May 27, 2019
.
Answers (1)
-
The table below shows percentage composition of blood plasma and urine from different substances.
Explain why;
i) There are no plasma proteins in the urine.
ii) Urea...
(Solved)
The table below shows percentage composition of blood plasma and urine from different substances.
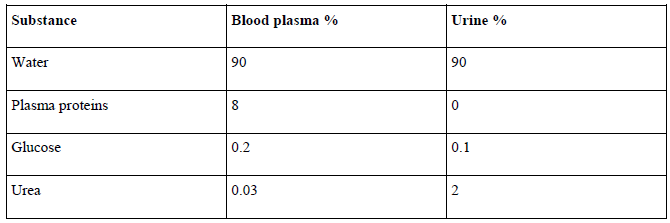
Explain why;
i) There are no plasma proteins in the urine.
ii) Urea concentration is greater in the urine than in the blood plasma.
iii) There is glucose in the urine
Date posted:
May 27, 2019
.
Answers (1)