-
Agnes paid rent which was
 of her net salary. She used ½ of the...
(Solved)
of her net salary. She used ½ of the...
(Solved)
Agnes paid rent which was of her net salary. She used ½ of the remaining amount to make a down payment for a plot. She gave her mother Kshs. 2,500 and did shopping worth Kshs. 7,500 for herself. She saved the remainder which was Ksh. 12,500. How much was the down payment that she made.
Date posted:
August 8, 2019
.
Answers (1)
-
A tangent from an external point A(7, 5) meets a circle centre O whose equation is
(Solved)
A tangent from an external point A(7, 5) meets a circle centre O whose equation is x2 + 4x + y2 – 5 = 0 at point T, find the length of the tangent AT
Date posted:
August 8, 2019
.
Answers (1)
-
Solve the following simultaneous equations, give the exact values of a and b.
(Solved)
Solve the following simultaneous equations, give the exact values of a and b.
log (a – b + 1) = 0 and log (ab) + 1 = 0
Date posted:
August 8, 2019
.
Answers (1)
-
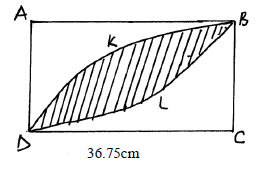
The figure drawn below is a square ABCD of sides 36.75cm.
(Solved)
The figure drawn below is a square ABCD of sides 36.75cm. The shaded area is formed out of
two segments. DCB and DKB. Find the area of the shaded region.
Date posted:
August 8, 2019
.
Answers (1)
-
Find all the integral values of x which satisfy the inequalities.
x + 8 > 4x - 6 = 3(4 - x)
(Solved)
Find all the integral values of x which satisfy the inequalities.
x + 8 > 4x - 6 ≥ 3(4 - x)
Date posted:
August 8, 2019
.
Answers (1)
-
A Kenyan bank buys and sells foreign currencies at the exchange rates shown below
(Solved)
A Kenyan bank buys and sells foreign currencies at the exchange rates shown below
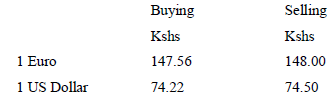
An American arrived in Kenya with 20,000 Euros. He converted all the Euros to Kenya shillings at the bank. He spent Ksh 2510200 while in Kenya and converted the remaining Kenya shillings into US dollars at the bank. Find the amount in Dollars that he received.
Date posted:
August 8, 2019
.
Answers (1)
-
If the points x, y and z are collinear, find the value of t
(Solved)
The position vectors of points x, y and z are 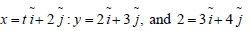 respectively. If the points x, y and z are collinear, find the value of t
Date posted:
August 8, 2019
.
Answers (1)
-
Triangle ABC has vertices A at (1, 4) and B at (0, 1) and the line y = x + 1 and its axis of
symmetry....
(Solved)
Triangle ABC has vertices A at (1, 4) and B at (0, 1) and the line y = x + 1 and its axis of
symmetry. Find the co-ordinates of C.
Date posted:
August 8, 2019
.
Answers (1)
-
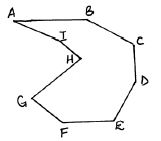
Find by calculation the sum of all the interior angles in the figure ABCDEFGHI below
(Solved)
Find by calculation the sum of all the interior angles in the figure ABCDEFGHI below
Date posted:
August 8, 2019
.
Answers (1)
-
The table below shows the number of goals scored in 40 soccer matches during a certain season.
(Solved)
The table below shows the number of goals scored in 40 soccer matches during a certain season.
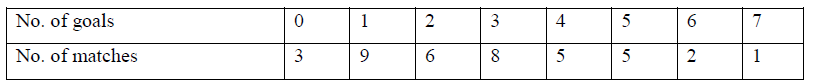
Calculate the mean number of goals scored per match.
Date posted:
August 8, 2019
.
Answers (1)
-
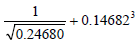
Use mathematical tables to evaluate to 4 decimal places.
(Solved)
Use mathematical tables to evaluate to 4 decimal places.
Date posted:
August 8, 2019
.
Answers (1)
-
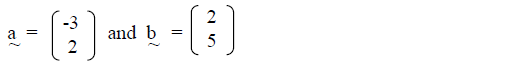
Given that position vectors of points A and B are as given below and C is a point on AB such that AC : CB...
(Solved)
Given that position vectors of points A and B are as given below and C is a point on AB such that AC : CB = 1 : 2. Find the coordinates of the point C.
Date posted:
August 8, 2019
.
Answers (1)
-
Simplify the expression
(Solved)
Simplify the expression 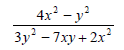
Date posted:
August 8, 2019
.
Answers (1)
-
Make x the subject of the formula
(Solved)
Make x the subject of the formula 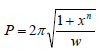
Date posted:
August 8, 2019
.
Answers (1)
-
Solve the simultaneous equations
xy = 4
x + y = 5
(Solved)
Solve the simultaneous equations
xy = 4
x + y = 5
Date posted:
August 8, 2019
.
Answers (1)
-
Find t
(Solved)

Date posted:
August 8, 2019
.
Answers (1)
-
Evaluate the expression.
(Solved)
Evaluate the expression.

Date posted:
August 8, 2019
.
Answers (1)
-
A trouser whose marked price is Kshs 800 is sold to a customer after allowing him a discount of
13%.
(Solved)
A trouser whose marked price is Kshs 800 is sold to a customer after allowing him a discount of
13%. If the trader makes a profit of 20%, find how much the trader paid for the trouser.
Date posted:
August 8, 2019
.
Answers (1)
-
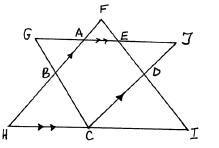
In the given figure, GJ is parallel to HI, FH is parallel to CJ.
(Solved)
In the given figure, GJ is parallel to HI, FH is parallel to CJ. Angle AGB = 300 and angle AHC
= 630. Find angle GCJ.
Date posted:
August 8, 2019
.
Answers (1)
-
Express the number 1470 and 7056 each as a product of its prime factor.
(Solved)
Express the number 1470 and 7056 each as a product of its prime factor. Hence evaluate  leaving the answer in prime factor form.
Date posted:
August 8, 2019
.
Answers (1)