-
Find the integral values of x which satisfy the simultaneous inequalities.
(Solved)
Find the integral values of x which satisfy the simultaneous inequalities.
3x-2<10+x <10+x
Date posted:
September 3, 2019
.
Answers (1)
-
A sector of a circle of radius 10cm has an arc that subtends an angle of 270o at the centre.
(Solved)
A sector of a circle of radius 10cm has an arc that subtends an angle of 270o at the centre.
Calculate the vertical height of the cone formed by the sector.
Date posted:
September 3, 2019
.
Answers (1)
-
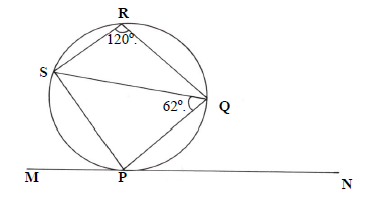
In the figure below MPN is a tangent to the circle at P. Find ?SPQ and ?NPQ, stating your reasons.
(Solved)
In the figure below MPN is a tangent to the circle at P. Find angle SPQ and angle NPQ, stating your reasons. Angle SRQ=120o and angle PQR=62o
Date posted:
September 3, 2019
.
Answers (1)
-
The line passing through the points P(5, b), Q(2,3) is parallel to the line 2y=-x+2. determine the value
of b.
(Solved)
The line passing through the points P(5, b), Q(2,3) is parallel to the line 2y=-x+2. Determine the value
of b.
Date posted:
September 3, 2019
.
Answers (1)
-
Simplify the expression
(Solved)
Simplify the expression

Date posted:
September 3, 2019
.
Answers (1)
-
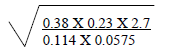
Without using mathematical table of calculator, evaluate:
(Solved)
Without using mathematical table of calculator, evaluate:
Date posted:
September 3, 2019
.
Answers (1)
-
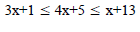
Find the integral values that satisfy the inequalities
(Solved)
Find the integral values that satisfy the inequalities

Date posted:
September 3, 2019
.
Answers (1)
-
Kamau bought five exercise books and three geometrical sets for sh.725.
(Solved)
Kamau bought five exercise books and three geometrical sets for sh.725. If he had bought four similar exercise books and five geometrical sets, he would have paid sh.375 more. How much would he pay for two exercise books and six geometrical sets.
Date posted:
September 3, 2019
.
Answers (1)
-
Find the percentage error in the perimeter of a regular polygon whose side is 15.0cm.
(Solved)
Find the percentage error in the perimeter of a regular polygon whose side is 15.0cm.
Date posted:
September 3, 2019
.
Answers (1)
-
Simplify
(Solved)
Simplify

Date posted:
September 3, 2019
.
Answers (1)
-
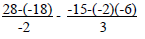
Evaluate
(Solved)
Evaluate
Date posted:
September 3, 2019
.
Answers (1)
-
The table below shows monthly income tax rates.
(Solved)
The table below shows monthly income tax rates.
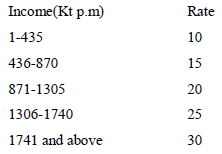
Mrs. Wanjala earns a monthly salary of Ksh.15,000 and a taxable travel allowance of Ksh. 5,000 per month. She is also provided with a house by the institution for which she pays a nominal rent of Ksh.1000 per month.
(a) Calculate the employees taxable income every month.
(b) Calculate the employees monthly total tax payable
(c) If the employee is entitled to a personal relief of Ksh.900 per month and a non taxable medical
allowance of Ksh.2,000. Calculate her net monthly income.
Date posted:
September 2, 2019
.
Answers (1)
-
(a) Complete the table given below for
(Solved)
(a) Complete the table given below for 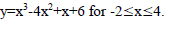
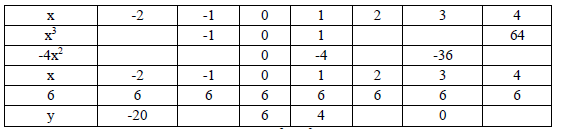
(b) On the grid provided draw the graph of y=x3- 4x2+x+6. Use a scale of 1cm to represent 2 units of the y-axis and 2cm to represent 1 unit on the x-axis.
(c) Use your graph to solve the equation. x3- 4x2 + x= - 6
(d) By drawing a suitable straight line on the same axis estimate the roots of the equation.
3x3-12x2-15x + 21 = 0
Date posted:
September 2, 2019
.
Answers (1)
-
Two ships leave a harbor K at the same time. One ship takes a course of 030o over a distance of 60km to a position...
(Solved)
Two ships leave a harbor K at the same time. One ship takes a course of 030o over a distance of 60km to a position P. The other ship sails 100km on a bearing of 110o to position Q.
(a) Calculate:
(i) Distance PQ.
(ii) Angle PQ.
(iii) The bearing of Q from P
(b) Both ships take t hours to reach their destinations. The speed of the faster ship is 20km/hr.
Find:
(i) The value of t
(ii) the speed of the slower ship.
Date posted:
September 2, 2019
.
Answers (1)
-
(a) Draw x and y axes for values of x from -8 to 16 and y from -10 to 16 using a scale of 1cm...
(Solved)
(a) Draw x and y axes for values of x from -8 to 16 and y from -10 to 16 using a scale of 1cm to 2
units. On your graph draw a triangle with vertices P (6,-8), Q(2,14) and R(9,13)
(b) Triangle P1Q1R1 is the image of PQR under a transformation whose matrix is  .
.
Write down the coordinates of P1Q1R1. Hence describe the transformation mapping PQR onto P1Q1R1.
(c) A reflection of PQR in the line x=0 gives triangle P11Q11R11. If P1Q1R1 is mapped onto P11Q11R11 by a rotation about (0,0). Find the angle of rotation.
Date posted:
September 2, 2019
.
Answers (1)
-
A solid is partly a cone and partly a hemisphere. The radius of the hemisphere is 5cm.
(Solved)
A solid is partly a cone and partly a hemisphere. The radius of the hemisphere is 5cm. the height of the solid is 17cm. Determine:
(a) The volume of the cone.
(b) The volume of the hemispherical part.
(c) The volume of the solid.
(d) The curved surface area of the cone.
(e) The curved surface area of the hemisphere.
(f) The total surface area of the solid.
Date posted:
September 2, 2019
.
Answers (1)
-
Solve for x. Hence state the integral values that satisfy the inequalities.
(Solved)
Solve for x. Hence state the integral values that satisfy the inequalities.
Date posted:
September 2, 2019
.
Answers (1)
-
1 kg of sugar density 1.1g/cm3 and 0.25kg of salt density 1.2g/cm3 are mixed together for a certain experiment.
(Solved)
1 kg of sugar density 1.1g/cm3 and 0.25kg of salt density 1.2g/cm3 are mixed together for a certain experiment. What is the density of the mixture. ( Give the answer to 4. s.f)
Date posted:
September 2, 2019
.
Answers (1)
-
Find the exact value of:
(Solved)
Find the exact value of:

Date posted:
September 2, 2019
.
Answers (1)
-
A cylindrical solid of length 20cm and radius 6cm is melted to form 12 similar conical solids of height 8cm.
(Solved)
A cylindrical solid of length 20cm and radius 6cm is melted to form 12 similar conical solids of height 8cm. Determine the radius of each conical solid.
Date posted:
September 2, 2019
.
Answers (1)