-
A form two student from Kimomo Secondary School found his dry cells leaking on removing from his torch. What would be the possible cause of...
(Solved)
A form two student from Kimomo Secondary School found his dry cells leaking on removing from his torch. What would be the possible cause of the leakage?
Date posted:
September 6, 2019
.
Answers (1)
-
A vibrator is sending out 8 ripples per second across a ripple water tank. The ripples are observed to be 4cm apart. Calculate the velocity...
(Solved)
A vibrator is sending out 8 ripples per second across a ripple water tank. The ripples are observed to be 4cm apart. Calculate the velocity of the ripples
Date posted:
September 6, 2019
.
Answers (1)
-
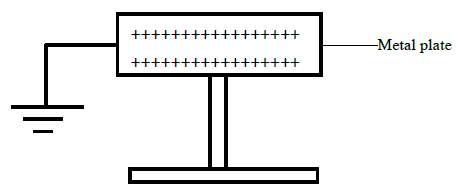
The figure below shows a positively charged metal plate with an earthing connection. State and explain the final charge of the plate.
(Solved)
The figure below shows a positively charged metal plate with an earthing connection. State and explain the final charge of the plate.
Date posted:
September 6, 2019
.
Answers (1)
-
The figure below shows a buoy of capacity 40 litres and mass 10kg. It is held in position in sea water of
density 1.04g/cm3 by a...
(Solved)
The figure below shows a buoy of capacity 40 litres and mass 10kg. It is held in position in sea water of
density 1.04g/cm3 by a light cable fixed to the bottom so that ¾ of its volume is below the water surface.
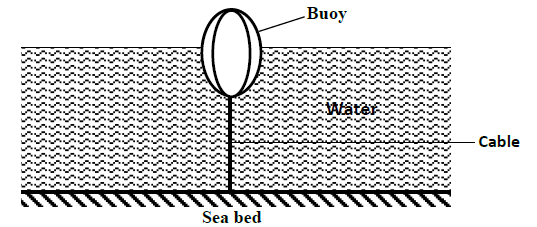
Determine the tension in the cable.
Date posted:
September 6, 2019
.
Answers (1)
-
A car decelerates uniformly from a velocity of 20m/s to rest in 4 seconds. It takes 4 seconds to reverse with uniform acceleration to its...
(Solved)
A car decelerates uniformly from a velocity of 20m/s to rest in 4 seconds. It takes 4 seconds to reverse with uniform acceleration to its original starting point.
(i) Sketch a velocity time graph for the motion of the car.
(ii) Use your sketch in c (i) to determine the total displacement of the car.
Date posted:
September 6, 2019
.
Answers (1)
-
The figure below shows the displacement – time graph of the motion of a particle.
State the nature of the motion of the particle between?
(i)...
(Solved)
The figure below shows the displacement – time graph of the motion of a particle.
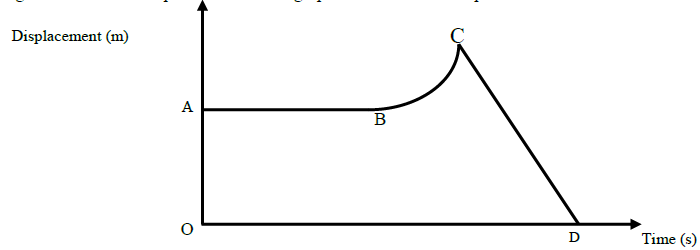
State the nature of the motion of the particle between?
(i) AB
(ii) BC
(iii CD
Date posted:
September 6, 2019
.
Answers (1)
-
A substance of mass 2kg and specific heat capacity 400J/kg/k initially at 800C is immersed in water at 190C. If the final temperature of the...
(Solved)
A substance of mass 2kg and specific heat capacity 400J/kg/k initially at 800C is immersed in water at 190C. If the final temperature of the mixture is 200C. Calculate the mass of water. (Specific heat capacity of water = 4200J/kg/k)
Date posted:
September 6, 2019
.
Answers (1)
-
A force of 20N is used to stretch a spring through 5cm. Calculate the elastic potential energy stored in the spring.
(Solved)
A force of 20N is used to stretch a spring through 5cm. Calculate the elastic potential energy stored in the spring.
Date posted:
September 6, 2019
.
Answers (1)
-
A pipe of radius 3mm is connected to another pipe of radius 9mm. If water flows in the water pipe at a speed of 2m/s,...
(Solved)
A pipe of radius 3mm is connected to another pipe of radius 9mm. If water flows in the water pipe at a speed of 2m/s, what is the speed in the narrower pipe?
Date posted:
September 6, 2019
.
Answers (1)
-
A uniform 120m metal rod is pivoted near one of its ends and kept in equilibrium by a spring balance as shown in the figure...
(Solved)
A uniform 120m metal rod is pivoted near one of its ends and kept in equilibrium by a spring balance as shown in the figure below.
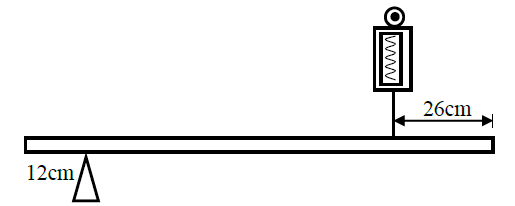
The reading indicated by the spring balance is 2.0N. Work out the mass of the metal rod. (g = 10N/kg)
Date posted:
September 6, 2019
.
Answers (1)
-
The spiral springs shown in the figure below are identical. Each spring has a constant K = 300N/m.
Determine the extension caused by the 150N weight...
(Solved)
The spiral springs shown in the figure below are identical. Each spring has a constant K = 300N/m.
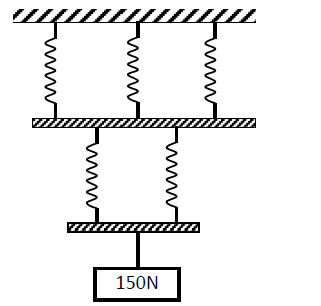
Determine the extension caused by the 150N weight (Ignore weight of springs and connecting rods)
Date posted:
September 6, 2019
.
Answers (1)
-
A micrometer screw gauge has a zero error of -0.02mm. It is used to measure the diameter of a wire. If the actual diameter of...
(Solved)
A micrometer screw gauge has a zero error of -0.02mm. It is used to measure the diameter of a wire. If the actual diameter of the wire is 0.28mm. Draw the micrometer screw gauge showing the diameter of the wire.
Date posted:
September 6, 2019
.
Answers (1)
-
Sodium has a work function of 2.3eV. Given that: Planck’s constant h = 6.63 x 10⁻³⁴JS, velocity of light in vacuum, C = 3.0 x10⁸m/s,...
(Solved)
Sodium has a work function of 2.3eV. Given that: Planck’s constant h = 6.63 x 10⁻³⁴JS, velocity of light in vacuum, C = 3.0 x10⁸m/s, 1 electron-volt (1eV) = 1.6 x 10⁻¹⁹ C and mass of an electron, me = 9.1 x 10⁻³¹kg, calculate:
(i) Its threshold frequency.
(ii) The maximum velocity of the photoelectrons produced when the sodium is illuminated by light of wavelength 5.0 x 10⁻⁷m.
(iii) The stopping potential V, with the light of this wavelength.
Date posted:
August 22, 2019
.
Answers (1)
-
A house has a lighting circuit operated from a 240V mains supply. Four bulbs rated 40W 240V and six bulbs rated 100W 240V are switched...
(Solved)
A house has a lighting circuit operated from a 240V mains supply. Four bulbs rated 40W 240V and six bulbs rated 100W 240V are switched on for 5 hours a day. Determine the monthly bill for the consumer given that the cost of electricity is at shs. 5.50 per unit.
(Take 1 month = 30 days and the standing charge is sh. 150)
Date posted:
August 22, 2019
.
Answers (1)
-
The figure below shows refraction of light at air-water interface.
(Solved)
The figure below shows refraction of light at air-water interface.
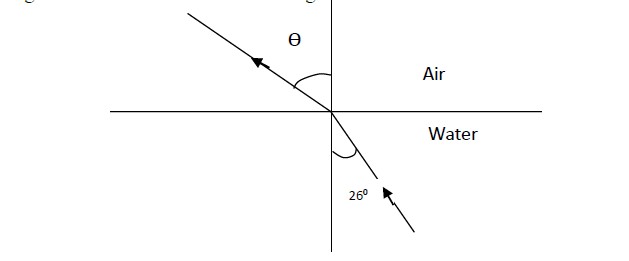
Determine angle Ө if the refractive index of water is 1.33
Date posted:
August 22, 2019
.
Answers (1)
-
The diagram in the figure below represents a wheel and axle used as a machine, whose efficiency is 80% to raise 400N of building materials....
(Solved)
The diagram in the figure below represents a wheel and axle used as a machine, whose efficiency is 80% to raise 400N of building materials. The wheel and axle have diameters of 75cm and 15cm respectively.
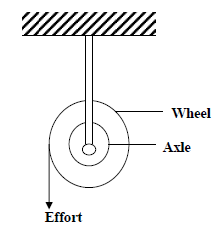
(i) Mark on the diagram the correct position and direction of the load to be lifted.
(ii) Name the principle on which this machine works.
(iii) Calculate the effort needed to raise the load.
(iv) The machine is operated manually and raises the load to a height of 5m in 20 seconds. Calculate the power developed by the operator
Date posted:
August 22, 2019
.
Answers (1)
-
A simple hydrometer is set up with a test –tube of mass 10g and length 12cm with a flat base and partially filled with lead...
(Solved)
A simple hydrometer is set up with a test –tube of mass 10g and length 12cm with a flat base and partially filled with lead shots. The test – tube has a uniform cross – sectional area of 2.0cm2 and 10cm of its length is under water as shown in the figure below.
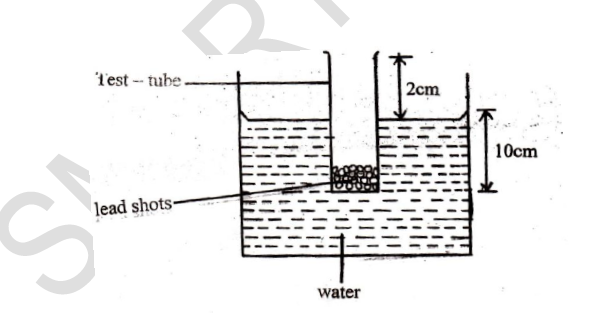
(i) Determine the mass of lead shots in the test – tube (Take density of water = 1000kgm-3)
(ii) Calculate the mass of the lead shots to be added if the test – tube has to displace an equal volume of a liquid of density 1.25gcm-3.
(iii) What is the function of the lead shots?
Date posted:
August 22, 2019
.
Answers (1)
-
A light spring that obeys Hooke’s law was attached to a fixed support. When a load of 10N was hung on it, the length of the...
(Solved)
A light spring that obeys Hooke’s law was attached to a fixed support. When a load of 10N was hung on it, the length of the spring was 320mm and when a 20N load was hung on it, the length became 400mm. Determine:
(i) The length of the spring when it has no load on it
(ii) The length of the spring when it has a load of 16N.
Date posted:
August 22, 2019
.
Answers (1)
-
The figure below shows two graphs for two different springs A and B
(Solved)
The figure below shows two graphs for two different springs A and B

F1 and F2 are points at which the springs break.
Determine and explain which of the two springs:
(i) Obeys Hooke’s law
(ii) Is stronger
Date posted:
August 22, 2019
.
Answers (1)
-
The diagram below shows a pendulum bob swinging freely to and from.
(Solved)
The diagram below shows a pendulum bob swinging freely to and from.
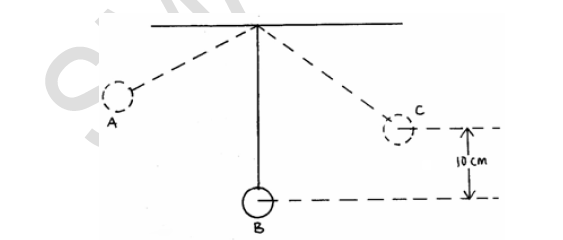
Determine the maximum velocity of the ball at B if the maximum horizontal displacement of the ball is 10cm.
Date posted:
August 22, 2019
.
Answers (1)