-
Outline the importance of oil exploitation in the Middle East countries.
(Solved)
Outline the importance of oil exploitation in the Middle East countries.
Date posted:
October 2, 2019
.
Answers (1)
-
Explain how diamonds are processed.
(Solved)
Explain how diamonds are processed.
Date posted:
October 2, 2019
.
Answers (1)
-
Name three main areas where tropical rain forests are found in the world.
(Solved)
Name three main areas where tropical rain forests are found in the world.
Date posted:
October 2, 2019
.
Answers (1)
-
Name a mineral which occurs in each one of the following places in East Africa.i) Kwale in Kenya. ii) Geita in Tanzania iii) Kilembe in...
(Solved)
Name a mineral which occurs in each one of the following places in East Africa.
i) Kwale in Kenya.
ii) Geita in Tanzania
iii) Kilembe in Uganda
Date posted:
October 2, 2019
.
Answers (1)
-
State three examples of rocks that are dominant at the coast of Kenya
(Solved)
State three examples of rocks that are dominant at the coast of Kenya
Date posted:
September 27, 2019
.
Answers (1)
-
Give the climatic conditions that favour oil palm growing in Nigeria.
(Solved)
Give the climatic conditions that favour oil palm growing in Nigeria.
Date posted:
September 27, 2019
.
Answers (1)
-
State three reasons why Kenya traders rely in raw materials rather than finished products
(Solved)
State three reasons why Kenya traders rely in raw materials rather than finished products
Date posted:
September 27, 2019
.
Answers (1)
-
State the main sugar cane growing areas in the L.Victoria basin.
(Solved)
State the main sugar cane growing areas in the L.Victoria basin.
Date posted:
September 27, 2019
.
Answers (1)
-
State five ways through which the government of Kenya assist small scale sugar cane farmers.
(Solved)
State five ways through which the government of Kenya assist small scale sugar cane farmers.
Date posted:
September 27, 2019
.
Answers (1)
-
Give three man-made hazards in your country.
(Solved)
Give three man-made hazards in your country.
Date posted:
September 26, 2019
.
Answers (1)
-
Study the map of the world below and use it to answer question (a) (i)
(Solved)
Study the map of the world below and use it to answer question (a) (i)
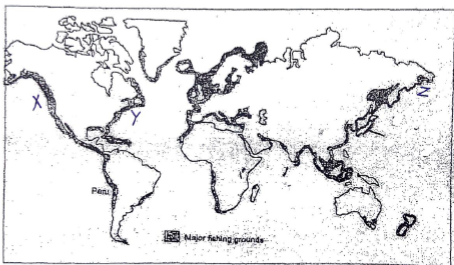
(a).
(i). Name the fishing grounds marked.
X -
Y -
(ii). Explain three physical factors influencing fishing in the region marked X on the map.
Date posted:
September 26, 2019
.
Answers (1)
-
Form four students in your school carried a field study on Thika town.
(i). Give four factors that led to growth of Thika as an industrial...
(Solved)
Form four students in your school carried a field study on Thika town.
(i). Give four factors that led to growth of Thika as an industrial centre.
(ii). Give four advantages of studying industry through field work
Date posted:
September 26, 2019
.
Answers (1)
-
State four physical factors that favored the establishment of Ruhr Industrial region in Germany.
(Solved)
State four physical factors that favored the establishment of Ruhr Industrial region in Germany.
Date posted:
September 26, 2019
.
Answers (1)
-
Explain three ways in which the government of Kenya can assist maize farmers in Kenya.
(Solved)
Explain three ways in which the government of Kenya can assist maize farmers in Kenya.
Date posted:
September 26, 2019
.
Answers (1)
-
The table below shows maize production in Kenya per county; between 2017 – 2018 in `000 kgs
(Solved)
The table below shows maize production in Kenya per county; between 2017 – 2018 in `000 kgs
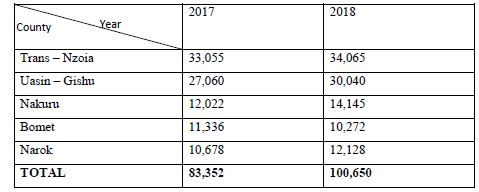
(i). Using a scale of 1cm to represent 10 million kgs, draw a divided rectangle to represent the data for maize production in 2018.
(ii). Describe the production of maize in the 5 counties in Kenya.
Date posted:
September 26, 2019
.
Answers (1)
-
Give two measures of conservation energy.
(Solved)
Give two measures of conservation energy.
Date posted:
September 26, 2019
.
Answers (1)
-
State three conditions necessary for the formation of ice.
(Solved)
State three conditions necessary for the formation of ice.
Date posted:
September 26, 2019
.
Answers (1)
-
Define the term Moraine.
(Solved)
Define the term Moraine.
Date posted:
September 26, 2019
.
Answers (1)
-
With the aid of a well-labelled diagram, describe the formation of cyclonic rainfall.
(Solved)
With the aid of a well-labelled diagram, describe the formation of cyclonic rainfall.
Date posted:
September 26, 2019
.
Answers (1)
-
The table below shows climatic figure for station Q. Use it to answer the questions that follow.
(Solved)
The table below shows climatic figure for station Q. Use it to answer the questions that follow.
(i) Calculate the annual range of temperature for station Q.
(ii) Give four characteristics of climate for station Q.
Date posted:
September 26, 2019
.
Answers (1)