-
The diagram below shows a solid made of a hemisphere and a cylinder. The radius of both the cylinder and the hemisphere is 3cm. The...
(Solved)
The diagram below shows a solid made of a hemisphere and a cylinder. The radius of both the cylinder and the hemisphere is 3cm. The length of the cylinder is 12cm.
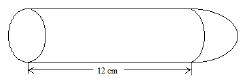
a) i) Calculate the volume of the solid.
ii) The solid fits in a box in the shape of a cuboid 15 cm by 6cm by 6cm. Calculate the volume of the box not occupied by the solid correct to four significant figures.
b) i) Calculate the total surface area of the solid correct to four significant figures.
ii) The surface of the solid is to be painted. One millilitre of paint covers an area of 8cm2. The cost of paint is Ksh 900 per litre. Calculate the cost of the paint required.
Date posted:
November 18, 2019
.
Answers (1)
-
The figure below shows triangle T with vertices P(2,4), Q(6,2) and R(4,8). It is mapped onto triangle T/ with vertices P/(10,0), Q/(8,-4) and R/(14, -2)...
(Solved)
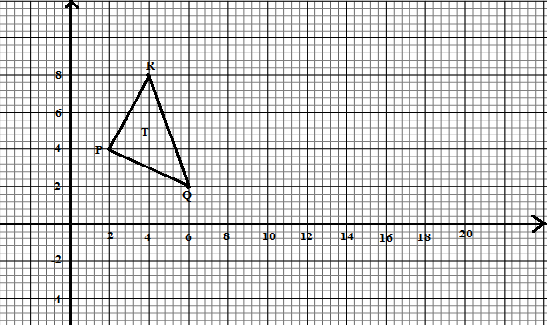
The figure below shows triangle T with vertices P(2,4), Q(6,2) and R(4,8). It is mapped onto triangle T/ with vertices P/(10,0), Q/(8,-4) and R/(14, -2) by a rotation.
Draw on the same axis T/ the image of triangle T.
Date posted:
November 18, 2019
.
Answers (1)
-
Line K whose equation is 2y - 6 = 4x is perpendicular to another line Q. Find the equation of line Q if it passes...
(Solved)
Line K whose equation is 2y - 6 = 4x is perpendicular to another line Q. Find the equation of line Q if it passes through point. (-2,7).
Date posted:
November 18, 2019
.
Answers (1)
-
Using trapezoid rule, estimate the area under the curve y = 1/2x2 - 2 bounded by lines, x =2 and x=8 and x –axis use...
(Solved)
Using trapezoid rule, estimate the area under the curve y = 1/2x2 - 2 bounded by lines, x =2 and x=8 and x –axis use six strips.
Date posted:
November 18, 2019
.
Answers (1)
-
In a mixed school there are 900 students, out of these 600 are girls.
(a) Find the ratio of boys to girls.
(b) What is the...
(Solved)
In a mixed school there are 900 students, out of these 600 are girls.
(a) Find the ratio of boys to girls.
(b) What is the percentage of boys in this school?
Date posted:
November 18, 2019
.
Answers (1)
-
During an annual general meeting at Elimu Mixed Day, goats and chicken were slaughtered. The number of heads for both chicken and goats were 45....
(Solved)
During an annual general meeting at Elimu Mixed Day, goats and chicken were slaughtered. The number of heads for both chicken and goats were 45. The total number of legs were 100. Determine the exact number of goats and chicken slaughtered.
Date posted:
November 18, 2019
.
Answers (1)
-
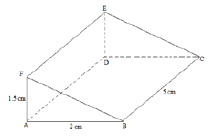
The diagram below represents a prism whose Cross-section is a right angled triangle. Draw the net of the solid.
(Solved)
The diagram below represents a prism whose Cross-section is a right angled triangle. Draw the net of the solid.
Date posted:
November 18, 2019
.
Answers (1)
-
Evaluate the value of x in 81x+1 + 34x = 246
(Solved)
Evaluate the value of x in 81𝑥+1 + 34𝑥 = 246
Date posted:
November 18, 2019
.
Answers (1)
-
A 890kg culvert is made of a hollow cylindrical material with outer radius of 76cm and an inner radius of 62cm. It crosses a road...
(Solved)
A 890kg culvert is made of a hollow cylindrical material with outer radius of 76cm and an inner radius of 62cm. It crosses a road of width 3m. Determine the density of the material used in its construction in Kg/m3 correct to one decimal place.
Date posted:
November 18, 2019
.
Answers (1)
-
Using logarithm table evaluate
(Solved)
Using logarithm table evaluate 
Date posted:
November 18, 2019
.
Answers (1)
-
When a certain number is divided by 48, 72 or 100 the remainder is 3 in each case. Find the number.
(Solved)
When a certain number is divided by 48, 72 or 100 the remainder is 3 in each case. Find the number.
Date posted:
November 18, 2019
.
Answers (1)
-
There are 2 bags A and B. Bag A has 4 white balls and 6 red balls. Bag B has 2 white balls and 3...
(Solved)
There are 2 bags A and B. Bag A has 4 white balls and 6 red balls. Bag B has 2 white balls and 3 red balls. Each bag has an equal chance of being picked. If a bag is selected randomly and 2 balls picked with replacement in bag A and without replacement in bag B. Find the probability that:
(a) They are both white
(b) They are of different colours
(c) At least one ball is red.
(d) None of the balls is white.
Date posted:
November 18, 2019
.
Answers (1)
-
Kamau bought a brand new motorbike for sh75000. Its depreciation rate is estimated at 12% per annum of its value at the beginning of each...
(Solved)
Kamau bought a brand new motorbike for sh75000. Its depreciation rate is estimated at 12% per annum of its value at the beginning of each of the first two years and 10% per annum thereafter. What will be the value of the motorbike at the end of five years.
Date posted:
November 18, 2019
.
Answers (1)
-
Find the value of x given that log(12 - 2x) - 1=log x - log 15.
(Solved)
Find the value of x given that log(12 − 2x) − 1=log x − log 15.
Date posted:
November 18, 2019
.
Answers (1)
-
Given that vectors OA= -8i + 2j and OB=6i + 4j and that T divides AB in the ratio 5:3, find TB in terms of...
(Solved)
Given that vectors OA= −8i + 2j and OB=6i + 4j and that T divides AB in the ratio 5:3, find TB in terms of i and j.
Date posted:
November 18, 2019
.
Answers (1)
-
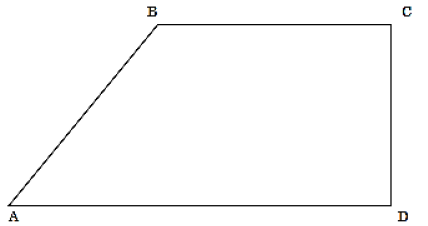
Cherop's farm is in the shape of a trapezium ABCD shown below. A borehole is to be drilled in the farm such that it is...
(Solved)
Cherop's farm is in the shape of a trapezium ABCD shown below. A borehole is to be drilled in the farm such that it is closer to AB than to side AD and closer to corner C than to corner D. Shade the region of all points where the borehole can be drilled.
Date posted:
November 18, 2019
.
Answers (1)
-
Without using a calculator or mathematical tables simplify
(Solved)
Without using a calculator or mathematical tables simplify

Date posted:
November 18, 2019
.
Answers (1)
-
Given that the column vectors
(a) Express a as column vector and hence calculate its magnitude.
(b) Given that the midpoints of PQ is (-3,1) and Q(7,5),...
(Solved)
Given that the column vectors
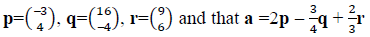
(a) Express a as column vector and hence calculate its magnitude.
(b) Given that the midpoints of PQ is (−3,1) and Q(7,5), obtain the co−ordinates of P.
(c) A translation T(2 1) maps triangle ABC onto triangle A′B′C′. Given the co–ordinates A(2,3), B(2,5) and C(4,4). Find the co-ordinates of A′B′C′.
Date posted:
November 18, 2019
.
Answers (1)
-
Given that log 5=0.6990 and log 7=0.8451, find log 24.5
(Solved)
Given that log 5=0.6990 and log 7=0.8451, find log 24.5
Date posted:
November 18, 2019
.
Answers (1)
-
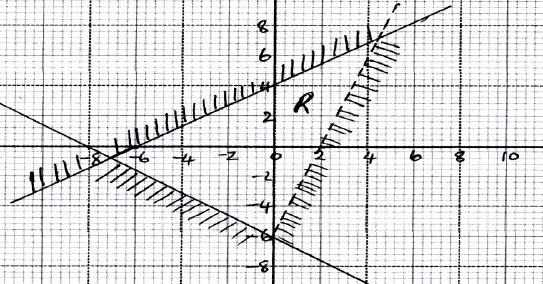
Determine the inequalities that define the unshaded region in the diagram below.
(Solved)
Determine the inequalities that define the unshaded region in the diagram below.
Date posted:
November 18, 2019
.
Answers (1)