-
An airplane leaves town A(400N,1550W) and flys to town B(400N,250E) using the shortest route and at a speed of 450 knot (Take ?? =3.142 and...
(Solved)
An airplane leaves town A(400N,1550W) and flys to town B(400N,250E) using the shortest route and at a speed of 450 knot (Take 𝜋 =3.142 and radius of the earth R=6370km.)
(a)i) Calculate the distance between A and B covered by the airplane in nautical miles.
ii) Calculate the time taken by the aeroplane to fly from A to B.
(b) From B the plane flies westwards along the latitude to a town C(400N, 130W). Calculate the distance BC in kilometres.
(c) From town C, The plane took off at 3:10 p.m towards town D(100N, 130W) at the same speed. At what time did the plane land at D?
Date posted:
November 19, 2019
.
Answers (1)
-
A car hire company hire out cars such that there is a fixed charge and another part which varies with the distance covered. Taking C...
(Solved)
A car hire company hire out cars such that there is a fixed charge and another part which varies with the distance covered. Taking C to stand for total cost, d for distance covered, k for fixed charge and t for charge per kilometer.
a) Express C in terms of k,tand d.
b) Given that the total cost is 7000 when the distance is 200km and the total cost is 11000 when distance is 400km.
i) Find the values of k and t.
ii) Find the equation connecting c,t,k and d.
(c) Find the cost of hiring a car to area a distance of 500km.
(d) Due to increase in fuel prices, the company increased the fixed charge by 20% and charge per kilometer by 10%:
i) Find the cost of hiring the car for 500km.
ii) Find the percentage increase of hiring the car for the 500km.
Date posted:
November 19, 2019
.
Answers (1)
-
Find the centre and the radius of a circle whose equation is x2 + y2 + 6y - 8x - 2y = 0.
(Solved)
Find the centre and the radius of a circle whose equation is x2 + y2 + 6y − 8x − 2y = 0.
Date posted:
November 18, 2019
.
Answers (1)
-
Evaluate
(Solved)
Evaluate 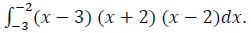
Date posted:
November 18, 2019
.
Answers (1)
-
Mutua wishes to take students from his mixed secondary school for a tour. The total number of students to be taken should not exceed 60....
(Solved)
Mutua wishes to take students from his mixed secondary school for a tour. The total number of students to be taken should not exceed 60. Each girl must contribute ksh. 10,000 and each boy Ksh. 15,000 and the total money contributed should not exceed ksh. 120,000. If this trip is to be successful the number of boys should be greater than the number of girls. Write down all the inequalities to represent this information taking the number of girls and boys to be y and x respectively.
Date posted:
November 18, 2019
.
Answers (1)
-
The table below is part of tax table for monthly income for the year 2006.
In the year 2006, the tax on Jane’s monthly income was...
(Solved)
The table below is part of tax table for monthly income for the year 2006.
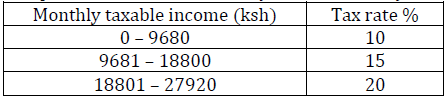
In the year 2006, the tax on Jane’s monthly income was Ksh. 1,916. Calculate Jane’s monthly income.
Date posted:
November 18, 2019
.
Answers (1)
-
Find the value of x that satisfies the equation. log(z+5)=log4 –log(x+2).
(Solved)
Find the value of x that satisfies the equation. log(z+5)=log4 –log(x+2).
Date posted:
November 18, 2019
.
Answers (1)
-
Given that p=2i-3j+k and q=3i-4j-3k find:
i) r=3p+2q
ii) |r|
(Solved)
Given that 𝒑=2𝒊−3𝒋+𝒌 and 𝒒=3𝒊−4𝒋−3𝒌 find:
i) 𝒓=3𝒑+2𝒒
ii) |𝒓|
Date posted:
November 18, 2019
.
Answers (1)
-
The length of a rectangle is (x+1) cm. its width is 3cm shorter than its length. Given that the area of the rectangle is 22cm,...
(Solved)
The length of a rectangle is (x+1) cm. its width is 3cm shorter than its length. Given that the area of the rectangle is 22cm, find its length using completing the square method.
Date posted:
November 18, 2019
.
Answers (1)
-
Make A the subject of the formula
(Solved)
Make A the subject of the formula 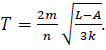
Date posted:
November 18, 2019
.
Answers (1)
-
Simplify
(Solved)
Simplify 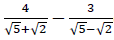
Date posted:
November 18, 2019
.
Answers (1)
-
Given that 8 = y = 12 and 1 = x = 6 find the maximum possible value of
(Solved)
Given that 8 ≤ y ≤ 12 and 1 ≤ x ≤ 6 find the maximum possible value of 
Date posted:
November 18, 2019
.
Answers (1)
-
Members of a group decides to raise k£ 100 towards a charity. Five of them were unable to contribute. Each of the rest had therefore...
(Solved)
Members of a group decides to raise k£ 100 towards a charity. Five of them were unable to contribute. Each of the rest had therefore to pay k£ 1 more, in order to raise the same amount.
a) If the original number of member was x, writes downs:
i) An expression of how much each was originally to contribute.
ii) Two distinct expressions of how much each contributed after the five pulled out.
b) Calculate the value of x.
c) Solve the equation 
Date posted:
November 18, 2019
.
Answers (1)
-
Two towns, Meru and Maua are 80km a part, Kimathi started cycling from Meru to Maua at 10:00 a.m at an average speed of 40km/h....
(Solved)
Two towns, Meru and Maua are 80km a part, Kimathi started cycling from Meru to Maua at 10:00 a.m at an average speed of 40km/h. Mutuma started his journey from Maua to Meru at 10:30 a.m and travelled by car at an average speed of 60km/h.
(a) Calculate:
i) The time taken by Kimathi and Mutuma to meet.
ii) The distance from Meru when Kimathi and Mutuma met.
iii) The time of the day when the two met.
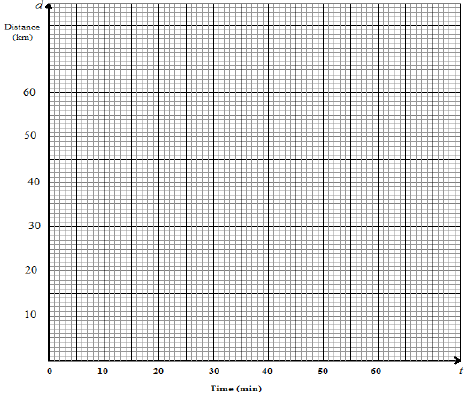
(b) Murianki cycled from his home to a school 6km away in 20 minutes. He stopped at the school for 5 minutes, before taking a motorbike to a town 40 km away. The motorbike travelled at 75km/h. On the grid provided, draw a distance time graph to represent Murianki’s journey.
Date posted:
November 18, 2019
.
Answers (1)
-
The table below shows the age groups and number of people who are HIV/ AIDS positive, in a certain sub county in Kenya.
a) State the...
(Solved)
The table below shows the age groups and number of people who are HIV/ AIDS positive, in a certain sub county in Kenya.

a) State the modal age group.
b) Calculate the mean age of the people who are HIV/AIDS Positive.
c) Calculate the median of the age group.
d) Draw on the grid provided a histogram to represent the above information.
Date posted:
November 18, 2019
.
Answers (1)
-
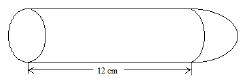
The diagram below shows a solid made of a hemisphere and a cylinder. The radius of both the cylinder and the hemisphere is 3cm. The...
(Solved)
The diagram below shows a solid made of a hemisphere and a cylinder. The radius of both the cylinder and the hemisphere is 3cm. The length of the cylinder is 12cm.
a) i) Calculate the volume of the solid.
ii) The solid fits in a box in the shape of a cuboid 15 cm by 6cm by 6cm. Calculate the volume of the box not occupied by the solid correct to four significant figures.
b) i) Calculate the total surface area of the solid correct to four significant figures.
ii) The surface of the solid is to be painted. One millilitre of paint covers an area of 8cm2. The cost of paint is Ksh 900 per litre. Calculate the cost of the paint required.
Date posted:
November 18, 2019
.
Answers (1)
-
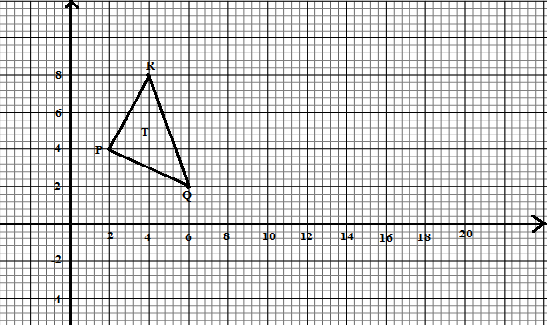
The figure below shows triangle T with vertices P(2,4), Q(6,2) and R(4,8). It is mapped onto triangle T/ with vertices P/(10,0), Q/(8,-4) and R/(14, -2)...
(Solved)
The figure below shows triangle T with vertices P(2,4), Q(6,2) and R(4,8). It is mapped onto triangle T/ with vertices P/(10,0), Q/(8,-4) and R/(14, -2) by a rotation.
Draw on the same axis T/ the image of triangle T.
Date posted:
November 18, 2019
.
Answers (1)
-
The figure below is not drawn to scale.
Find correct to 1 decimal place;
(a) Length PQ.
(b) Angle ABC
(Solved)
The figure below is not drawn to scale.
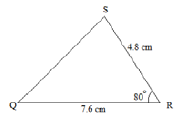
Find correct to 1 decimal place;
(a) Length PQ.
(b) Angle ABC
Date posted:
November 18, 2019
.
Answers (1)
-
Line K whose equation is 2y - 6 = 4x is perpendicular to another line Q. Find the equation of line Q if it passes...
(Solved)
Line K whose equation is 2y - 6 = 4x is perpendicular to another line Q. Find the equation of line Q if it passes through point. (-2,7).
Date posted:
November 18, 2019
.
Answers (1)
-
Using trapezoid rule, estimate the area under the curve y = 1/2x2 - 2 bounded by lines, x =2 and x=8 and x –axis use...
(Solved)
Using trapezoid rule, estimate the area under the curve y = 1/2x2 - 2 bounded by lines, x =2 and x=8 and x –axis use six strips.
Date posted:
November 18, 2019
.
Answers (1)