As the temperature increases the time needed for the reaction to take place reduces. Thus increase in temperature increases the rate of reaction.
johnmulu answered the question on April 27, 2017 at 07:27
-
The curves below represents the change in mass when equal masses of powdered zinc and zinc granules were reacted with excess 2 M hydrochloric acid. Study them and answer the question below
(Solved)
The curves below represents the change in mass when equal masses of powdered zinc and zinc granules were reacted with excess 2 M hydrochloric acid. Study them and answer the question below
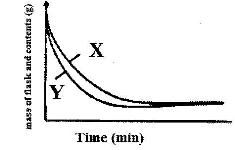
Which curve represents the reaction with zinc granules? Explain answer.
Date posted:
April 27, 2017
.
Answers (1)
-
Ammonia gas is used to manufacture nitric (V) acid as shown below.
(Solved)
Ammonia gas is used to manufacture nitric (V) acid as shown below.
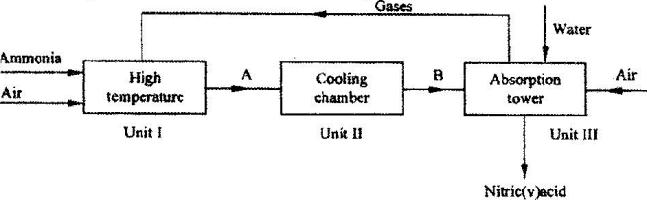
i) This process requires the use of a catalyst. In which unit is the catalyst used?
ii) Identify compound A and B.
Date posted:
April 27, 2017
.
Answers (1)
-
A student set up the apparatus as shown in the diagram below to prepare and collect dry
Ammonia gas
(Solved)
A student set up the apparatus as shown in the diagram below to prepare and collect dry
Ammonia gas
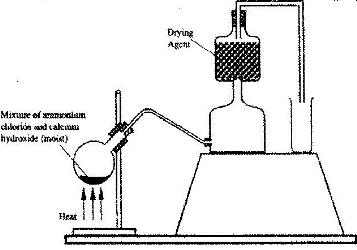
i) Identify two mistakes in the set up and give a reason for each mistake.
ii) Name a suitable drying agent for ammonia.
iii) Describe one chemical test for ammonia gas
Date posted:
April 27, 2017
.
Answers (1)
-
Study the energy level diagram below and answer the question that follows
(Solved)
Study the energy level diagram below and answer the question that follows
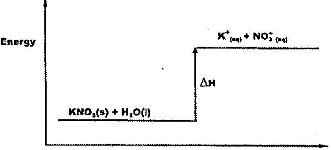
What type of reaction is represented by the diagram?
Date posted:
April 27, 2017
.
Answers (1)
-
A student investigated a property of acids M and N by reacting equal volumes of acid M and N of the same concentration with equal volumes of 2 M potassium hydroxide. The results were recorded in the table below
(Solved)
A student investigated a property of acids M and N by reacting equal volumes of acid M and N of the same concentration with equal volumes of 2 M potassium hydroxide. The results were recorded in the table below
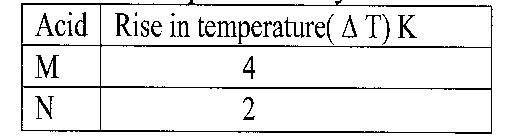
a) Which of the acids is likely to be a weak acid? Explain.
b) Write the equation for the reaction between ethanoic acid and potassium hydroxide.
Date posted:
April 27, 2017
.
Answers (1)
-
50 cm3 of 1 M copper (II) sulphate solution was placed in 100 cm
(Solved)
50 cm3 of 1 M copper (II) sulphate solution was placed in 100 cm 3 plastic beaker. The temperature of the solution was measured. Excess metal A powder was added to the solution, the mixture stirred, and the maximum temperature of the mixture measured. The experiment was repeated using powders of metals B and C. The results obtained are given in the table below;
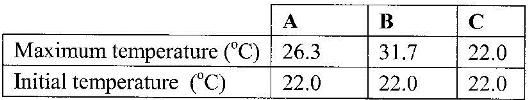
i) Arrange the metals A, B, C and copper in order of reactivity starting with the least reactive. Give reasons for the order.
ii) Other than temperature change, state one other observation that was made when the most reactive metal was added to copper (II) sulphate solution
Date posted:
April 27, 2017
.
Answers (1)
-
Figure 4 shows the heating curve for water.
(Solved)
Figure 4 shows the heating curve for water.
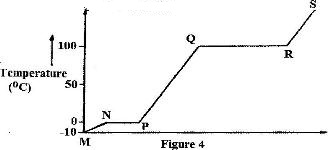
i) Give the names of the intermolecular forces of attraction in the segments:
I. MN
II. RS
ii) The heats of fusion and vaporization of water are 334.4 Jg-1 and 1159.4 g-1 respectively
I. Explain why there is a big difference between the two.
II. How is the difference reflected in the curve?
Date posted:
April 27, 2017
.
Answers (1)
-
In the flow chart below, some processes have been identified and others labeled. Study it and answer the questions that follow.
(Solved)
In the flow chart below, some processes have been identified and others labeled. Study it and answer the questions that follow.
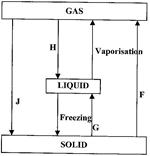
i) Give the names of the processes:
I. H
II. G
ii) Name one substance that can undergo process F when left in an open container in the laboratory.
iii) The process J is called deposition. Using water as an example, write an equation that represents the process of deposition.
Date posted:
April 27, 2017
.
Answers (1)
-
Two different samples of water (I and II) were tested with soap solution
(Solved)
Two different samples of water (I and II) were tested with soap solution. Sample II was further subjected to two other processes before adding soap. 20 cm3 of each sample of water was shaken with soap solution in a boiling tube until a permanent lather was obtained. The results are as shown in the table below.
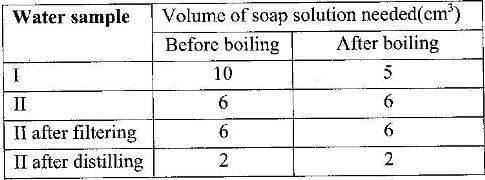
i) Identify the water sample that had temporary hardness. Explain your answer
ii) Explain why the results for sample II are different after distilling but remain unchanged after filtering
iii) State two disadvantages of using both water samples for domestic purposes.
Date posted:
April 27, 2017
.
Answers (1)
-
The table below shows the pH values of solutions A, B, C and D.
(Solved)
The table below shows the pH values of solutions A, B, C and D.
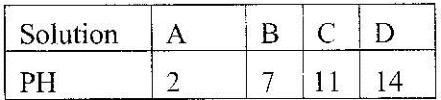
Select solutions in which a sample of lead (II) hydroxide is likely to dissolve. Give reasons for each solution selected.
Date posted:
April 27, 2017
.
Answers (1)
-
The table below gives the solubilities of substances T and U at 10o C and 40oC
(Solved)
The table below gives the solubilities of substances T and U at 10o C and 40oC
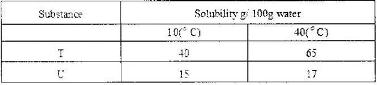
When an aqueous mixture containing 55 g of T and 12 g of U at 80o C was cooled to 10oC, crystals formed.
a) Identify the crystals formed.
b) determine the mass of the crystals formed
c) Name the method used to obtain the crystals
Date posted:
April 27, 2017
.
Answers (1)
-
Study the information in the table below and answer the questions that follow.
(Solved)
Study the information in the table below and answer the questions that follow.
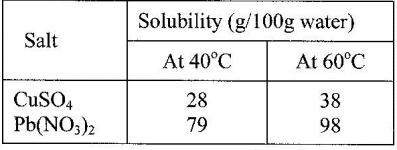
A mixture containing 35g of CuSO4 and 78 g of Pb(NO3)2 in 100 g of water at 60o was cooled to 40oC
a) What salt crystallized out? Give a reason.
b) Calculate the mass of salt that crystallised out.
Date posted:
April 21, 2017
.
Answers (1)
-
The curves below show how the electrical conductivity of hydrochloric and ethanoic acids vary with concentration.
(Solved)
The curves below show how the electrical conductivity of hydrochloric and ethanoic acids vary with concentration.
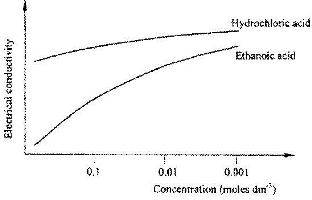
Explain why the electrical conductivity of 0.01 M hydrochloric acid is higher than that of 0.01 M ethanoic acid
Date posted:
April 21, 2017
.
Answers (1)
-
The solubility curve of potassium nitrate is shown below
(Solved)
The solubility curve of potassium nitrate is shown below
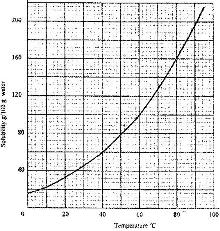
a) Determine the solubility of potassium nitrate at 50oC
b) determine the molar concentration of saturated potassium nitrate at 50o(K = 39.0; 0 = 16.0; N = 14.0 and density of water 1g/cm3)
Date posted:
April 21, 2017
.
Answers (1)
-
The table below gives the solubilities of substances J, K and L at different temperatures
(Solved)
The table below gives the solubilities of substances J, K and L at different temperatures
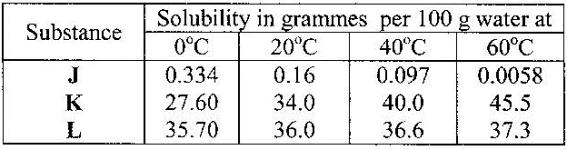
select the substance which, when dissolved in water, heat is given out. Give a reason.
Date posted:
April 21, 2017
.
Answers (1)
-
The graph shows how the pH value of soil in a farm changed over a period of time
(Solved)
The graph shows how the pH value of soil in a farm changed over a period of time
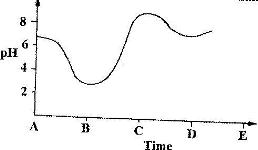
i) Describe how the pH of the soil can be determined
ii) State one factor that may have been responsible for the change in the soil pH in the time interval AB.
Date posted:
April 21, 2017
.
Answers (1)
-
The set-up below was used to demonstrate the effect of heat on hard water
(Solved)
The set-up below was used to demonstrate the effect of heat on hard water
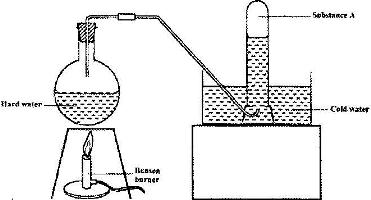
a) Name substance A.
b) Explain why the heating of hard water produced substance A.
Date posted:
April 21, 2017
.
Answers (1)
-
In an experiment, student put equal volumes of mixtures of ethanoic acid in water and ethanoic acid in hexane in two test-tubes as shown below. In each test-tube, equal amounts of solid hydrogen carbonate were added.
(Solved)
In an experiment, student put equal volumes of mixtures of ethanoic acid in water and ethanoic acid in hexane in two test-tubes as shown below. In each test-tube, equal amounts of solid hydrogen carbonate were added.
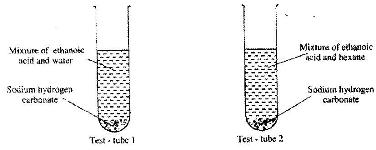
a) State the observation which was made in each test-tube.
b) Explain the observation in (a) above.
Date posted:
April 21, 2017
.
Answers (1)
-
The table below shows the tests carried out on a sample of water and the results obtained.
(Solved)
The table below shows the tests carried out on a sample of water and the results obtained.
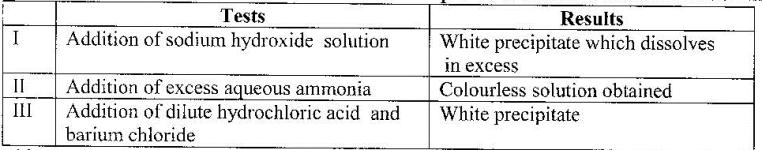
a) Identify the anion present in the water.
b) Write the formula of the complex ion formed in II
Date posted:
April 21, 2017
.
Answers (1)
-
In an experiment equal amounts of magnesium powder were placed into test-tube 1 and 2 as shown below
(Solved)
In an experiment equal amounts of magnesium powder were placed into test-tube 1 and 2 as shown below
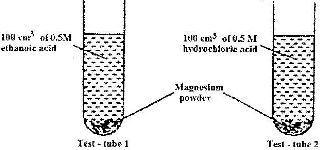
Explain why the amount of hydrogen gas liberated in test - tube 2 is greater than in test-tube 1 before the reaction is complete
Date posted:
April 21, 2017
.
Answers (1)