-
In the figure below, O is the centre of the circle of radius 3cm and AB is a chord such that its shortest distance from...
(Solved)
In the figure below, O is the centre of the circle of radius 3cm and AB is a chord such that its shortest distance from O is 1cm.
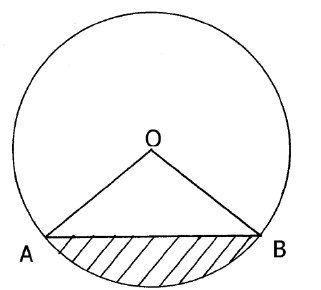
Calculate :
a) The length of the chord AB.
b) Angle AOB
c) The area of the minor sector OAB.
d) The area of the shaded segment.
Date posted:
August 14, 2019
.
Answers (1)
-
Mr. Barmuriat a farmer in Ainamoi division , Kericho District has a triangular field, ABC. The ratio of the length AB: AC = 6:7. If...
(Solved)
Mr. Barmuriat a farmer in Ainamoi division , Kericho District has a triangular field, ABC. The ratio of the length AB: AC = 6:7. If BC = 40m and the perimeter of the field is 118m,.
a) Calculate the length AB and the area of the field.
b) A water tap is installed inside the field such that the tap is equidistant from each of the vertices of the plot. Calculate the distance of the tap from vertex A.
c) Find the size of the acute angles between the edges AB and BC.
Date posted:
August 14, 2019
.
Answers (1)
-
Two types of tea in Kericho grade A and grade B are mixed. Grade A costs sh. 85 per kg, and grade B costs sh....
(Solved)
Two types of tea in Kericho grade A and grade B are mixed. Grade A costs sh. 85 per kg, and grade B costs sh. 70 per kg.
a) If the tea are mixed in the ratio 2:1, find the cost 2kg of the mixture.
b) The tea is to be sold in 2kg boxes at a 30% profit. Find the selling price of the tea.
c) At the end of the week the price of a 2kg box is reduced to sh. 125. Find the percentage reduction in the price .
d) Origianally 200kg of grade A and 100kg of grade B were bought 240kg of the mixture was sold at the price of part b, and the rest was sold at the reduced price of part C. Find the overall percentage profit.
Date posted:
August 14, 2019
.
Answers (1)
-
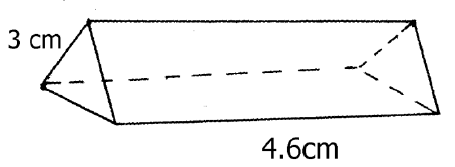
Construct a net of the triangular prism shown, where the cross section is an equilateral triangle.Hence calculate the surface area of the prism.
(Solved)
Construct a net of the triangular prism shown, where the cross section is an equilateral triangle.Hence calculate the surface area of the prism.
Date posted:
August 14, 2019
.
Answers (1)
-
The angles of a quadrilateral are 3x, 2x, x +14 and 2( x – 7) degrees. Find the smallest angle.
(Solved)
The angles of a quadrilateral are 3x, 2x, x +14 and 2( x – 7) degrees. Find the smallest angle.
Date posted:
August 13, 2019
.
Answers (1)
-
Three quantities t, x and y are such that t varies directly as x and inversely as the square root of y.
Find the percentage decrease...
(Solved)
Three quantities t, x and y are such that t varies directly as x and inversely as the square root of y.
Find the percentage decrease in t if x decreases by 44%.
Date posted:
August 13, 2019
.
Answers (1)
-
The heights (cm) of some seedlings in a nursery are recorded in the table below.
a) Calculate the mean height of seedlings in the nursery.
b)...
(Solved)
The heights (cm) of some seedlings in a nursery are recorded in the table below.

a) Calculate the mean height of seedlings in the nursery.
b) Estimate the median height of the seedlings in the nursery.
c) On the grid provided, draw a histogram to represent the information.
Date posted:
August 13, 2019
.
Answers (1)
-
In the figure below (not drawn to scale) OABC is a parallelogram. AB is produced to T such that AB:BT = 3 : 1 and OA...
(Solved)
In the figure below (not drawn to scale) OABC is a parallelogram. AB is produced to T such that AB:BT = 3 : 1 and OA is produced to R such that OA : OR = 3 : 5. Given that OA = a and OC = c;
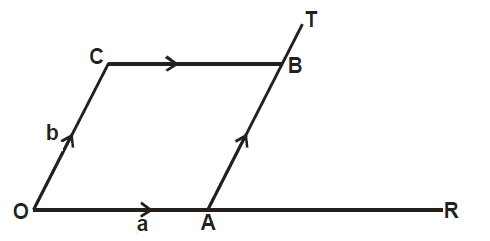
Express in terms of a and c vectors.
a) AC
b) CR
c) AT
d) CT
e) RT
Date posted:
August 13, 2019
.
Answers (1)
-
Town Q is 180km on bearing of 050o from town P. Another town R is on a bearing 110o from P and also on compass...
(Solved)
Town Q is 180km on bearing of 050o from town P. Another town R is on a bearing 110o from P and also on compass bearing S 30oE from Q. Town S is South of P and also West of R
Using scale 1 cm rep. 20 km;
a) Draw the scale diagram to show the positions of the four towns.
b) Use your scale diagram in (a) above to find;
i) The distance of R from P.
ii) The bearing of Q from S.
iii) The distance of Q from S.
iv) How far P is North of S.
Date posted:
August 13, 2019
.
Answers (1)
-
Two friends Jane and Tom live 40km apart. One day Jane left her house at 9.00am and cycled towards Tom’s house at an average speed...
(Solved)
Two friends Jane and Tom live 40km apart. One day Jane left her house at 9.00am and cycled towards Tom’s house at an average speed of 15km/hr. Tom left at 10.30am on the same day and cycled towards Jane’s house at an average speed of 25km/hr.
a) Determine;
i) The distance from Jane’s house, where the two friends met.
ii) The time they met.
iii) How far Jane was from Tom’s house when they met?
b) The two friends took 10 minutes at the meeting point and they cycled to Tom’s house at an average speed of 12km/hr. Find the time they arrived at Tom’s house.
Date posted:
August 13, 2019
.
Answers (1)
-
The figure below shows a glass in form of a frustrum of a cone whose top and bottom diameter of 7cm and 3.5cm respectively. Its depth...
(Solved)
The figure below shows a glass in form of a frustrum of a cone whose top and bottom diameter of 7cm and 3.5cm respectively. Its depth is 10cm.
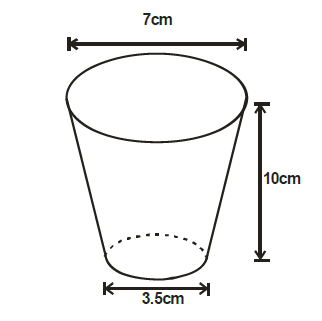
Calculate;
a) Its total surface area.
b) Its capacity.
Date posted:
August 13, 2019
.
Answers (1)
-
Determine the obtuse angle made by line 3x – 2y = 6 and x-axis.
(Solved)
Determine the obtuse angle made by line 3x – 2y = 6 and x-axis.
Date posted:
August 13, 2019
.
Answers (1)
-
Solve for x in the logarithm equation.
log (3x – 4) – log (3 – x) = 1
(Solved)
Solve for x in the logarithm equation.
log (3x – 4) – log (3 – x) = 1
Date posted:
August 13, 2019
.
Answers (1)
-
A positive two digit number is such that the product of the digits is 24. When the digits are reversed, the number formed is greater...
(Solved)
A positive two digit number is such that the product of the digits is 24. When the digits are reversed, the number formed is greater than original number by 18. Find the number.
Date posted:
August 13, 2019
.
Answers (1)
-
The surface area of two cylindrical water tanks are 50m2 and 162m2 respectively. Given that the volume of water in the second tank is 36450m3,...
(Solved)
The surface area of two cylindrical water tanks are 50m2 and 162m2 respectively. Given that the volume of water in the second tank is 36450m3, find the volume of water in the first tank if it’s half full.
Date posted:
August 13, 2019
.
Answers (1)
-
A line passing through points P (4, a) and Q (3, 2) is perpendicular to the line 3y + x + 3 = 0. Find...
(Solved)
A line passing through points P (4, a) and Q (3, 2) is perpendicular to the line 3y + x + 3 = 0. Find the value of a and write down equation of line PQ.
Date posted:
August 13, 2019
.
Answers (1)
-
A matatu left town A at 7.00 a.m and travelled towards a town B at an average speed of 60km/h.
A second matatu left town B...
(Solved)
A matatu left town A at 7.00 a.m and travelled towards a town B at an average speed of 60km/h.
A second matatu left town B at 8.00 a.m and travelled towards town A at an average 60 km/h. If the distance between the two towns is 400 km, find:
a) The time at which the two matatus met.
b) The distance of the meeting point from town A.
Date posted:
August 13, 2019
.
Answers (1)
-
The figure below shows a circle centre O. PQRS is a cyclic quadrilateral and QOS is a straight line.
Giving reasons for your answers, find the...
(Solved)
The figure below shows a circle centre O. PQRS is a cyclic quadrilateral and QOS is a straight line.
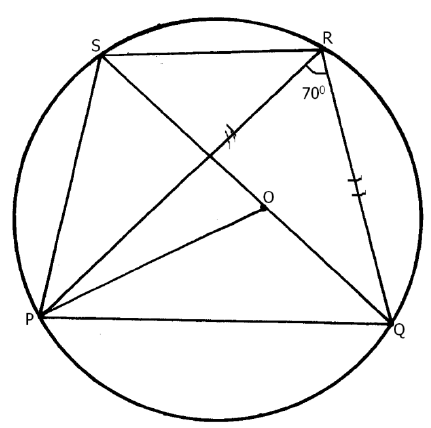
Giving reasons for your answers, find the value of:
a) b) c) d) e) Reflex
Date posted:
August 13, 2019
.
Answers (1)
-
A motorist is to follow the route ABCD. B is 250 km from A on a bearing of N750E from A. C is on a...
(Solved)
A motorist is to follow the route ABCD. B is 250 km from A on a bearing of N750E from A. C is on a bearing of S750E from A and 275 km from B. D is 300 m on a bearing of S800E from B. Using a scale of 1 cm to represent 50 km;
a) Show the relative position of ABCD.
b) Determine:
i) The distance of A from C
ii) The bearing of B from C
iii) The distance of A from D
iv) The compass bearing of C from D
Date posted:
August 13, 2019
.
Answers (1)
-
The figure below shows the net of a regular rectangular based pyramid. The rectangle measures 18 cm by 15 cm. N and K are mid-points...
(Solved)
The figure below shows the net of a regular rectangular based pyramid. The rectangle measures 18 cm by 15 cm. N and K are mid-points of AD and BC respectively. AB=18 cm and BC= 15 cm while VK=16 cm. V is the vertex and O is the centre of the rectangle ABCD.
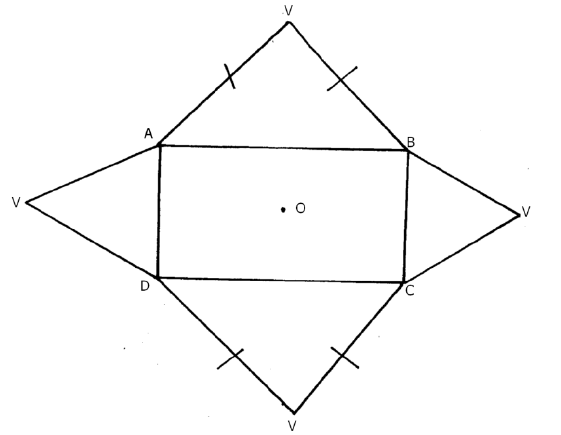
a).Sketch the pyramid and label all the vertices
b) From the diagram in (a) above, calculate to 2 decimal places.
i) Length CV
ii) Length VO
iii) The angle between the plane VCB and the base ABCD.
iv) The angle between the plane BVC and AVD
Date posted:
August 13, 2019
.
Answers (1)