-
Study the sketch map of Ghana below and use it to answer the following questions
(Solved)
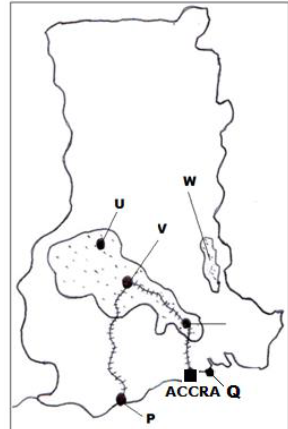
Study the sketch map of Ghana below and use it to answer the following questions.
a) Name
(i) The cocoa growing areas marked U, V and W
ii) The port cities marked P and Q
b) State five physical conditions favoring cocoa growing in Ghana
c) Describe the stages involved in cocoa processing in Ghana.
d) Explain four economic problems facing cocoa farmers in Ghana
Date posted:
September 11, 2019
.
Answers (1)
-
Study the map of East Africa below and use it to answer question.
(Solved)
Study the map of East Africa below and use it to answer question.
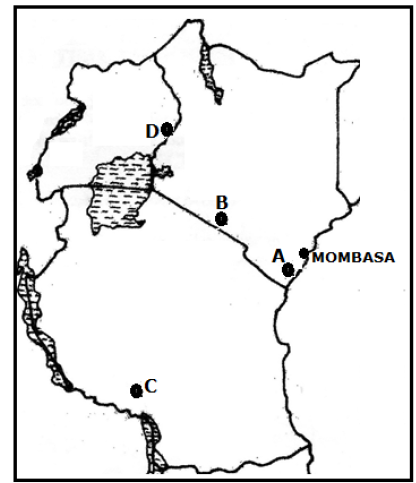
a)Identify the minerals in the parts marked A, B, C and D.
(b)
(i) Apart from solution method, give three other methods of underground mining..
(ii) Describe how minerals are extracted using solution method.
(c) State four negative effects of mining on the environment.
(d) Explain four contributions of petroleum production to the economies of Middle East countries.
Date posted:
September 11, 2019
.
Answers (1)
-
Name two indigenous breeds of cattle kept by nomadic pastoralists in Kenya.
(Solved)
Name two indigenous breeds of cattle kept by nomadic pastoralists in Kenya.
Date posted:
September 11, 2019
.
Answers (1)
-
State three characteristics of oblique aerial photographs.
(Solved)
State three characteristics of oblique aerial photographs.
Date posted:
September 11, 2019
.
Answers (1)
-
What is the time in Hola 40oE when the time in Accra 0o Longitude is 3p.m?
(Solved)
What is the time in Hola 40oE when the time in Accra 0o Longitude is 3p.m?
Date posted:
August 22, 2019
.
Answers (1)
-
Explain four ways in which human activity have affected rivers in Kenya
(Solved)
Explain four ways in which human activity have affected rivers in Kenya
Date posted:
August 22, 2019
.
Answers (1)
-
The instrument below is used to measure an element of weather .Study it and answer the questions below
(Solved)
The instrument below is used to measure an element of weather .Study it and answer the questions below.
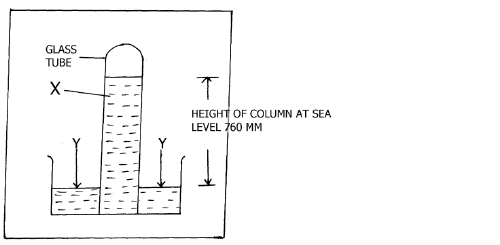
i) Name the liquid marked X.
ii) Identify the instrument above.
iii).Describe how the instrument works.
Date posted:
August 22, 2019
.
Answers (1)
-
If the time at 1200E is 3.00 pm Friday what is the local time and day at longitude 1650E.
(Solved)
If the time at 1200E is 3.00 pm Friday what is the local time and day at longitude 1650E.
Date posted:
August 22, 2019
.
Answers (1)
-
Describe lateralization process of leaching
(Solved)
Describe lateralization process of leaching.
Date posted:
August 16, 2019
.
Answers (1)
-
Distinguish between soil profile and soil catena.
Explain how the following factors influence soil formation
The parent rock
Relief
(Solved)
Distinguish between soil profile and soil catena.
Explain how the following factors influence soil formation
The parent rock
Relief
Date posted:
August 16, 2019
.
Answers (1)
-
What are the possible solutions to land dereliction?
(Solved)
What are the possible solutions to land dereliction?
Date posted:
August 16, 2019
.
Answers (1)
-
Name the major types industries located in Thika town.
(Solved)
Name the major types industries located in Thika town.
Date posted:
August 15, 2019
.
Answers (1)
-
Distinguish between a fault and a fold.
(Solved)
Distinguish between a fault and a fold.
Date posted:
August 15, 2019
.
Answers (1)
-
What does Kenya stand to gain by the revival of the East African Community?
(Solved)
What does Kenya stand to gain by the revival of the East African Community?
Date posted:
August 15, 2019
.
Answers (1)
-
List any three factors that influence international trade.
(Solved)
List any three factors that influence international trade.
Date posted:
August 15, 2019
.
Answers (1)
-
Name any country in Africa where Nuclear power is produced.
(Solved)
Name any country in Africa where Nuclear power is produced.
Date posted:
August 15, 2019
.
Answers (1)
-
Besides fish farming, what other measures have African countries undertaken to promote the growth of fishing industry?
(Solved)
Besides fish farming, what other measures have African countries undertaken to promote the growth of fishing industry?
Date posted:
August 15, 2019
.
Answers (1)
-
Explain any five advantages of fish farming in Kenya.
(Solved)
Explain any five advantages of fish farming in Kenya.
Date posted:
August 15, 2019
.
Answers (1)
-
Explain four conditions necessary for fishing.
(Solved)
Explain four conditions necessary for fishing.
Date posted:
August 15, 2019
.
Answers (1)
-
State three factors that could affect the future development of tourism in Kenya.
(Solved)
State three factors that could affect the future development of tourism in Kenya.
Date posted:
August 15, 2019
.
Answers (1)