(i) B ; The acid had higher concentration
(ii) The rate of reaction is initially high because of high concentration of the reactant but decreases steadily as the concentration also decreases.
maurice.mutuku answered the question on October 29, 2019 at 06:43
-
The sketch below shows the rate at which substance T is converted into U. Study it and answer the questions that follows:-
(Solved)
The sketch below shows the rate at which substance T is converted into U. Study it and answer the questions that follows:-
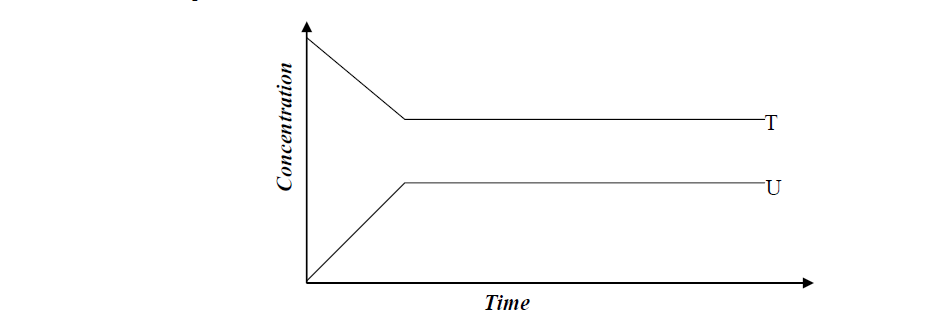
When the equilibrium has been established the two curves become horizontal after sometime.
Explain the effect of the amount of the two reactants and products
Date posted:
October 29, 2019
.
Answers (1)
-
What is meant by activation energy?
(Solved)
What is meant by activation energy?
Date posted:
October 29, 2019
.
Answers (1)
-
What is the effect on the position of equilibrium of the above system if temperature is decreased? Give a reason
(Solved)

What is the effect on the position of equilibrium of the above system if temperature is decreased? Give a reason
Date posted:
October 29, 2019
.
Answers (1)
-
The following is a thermochemical equation for the reaction between hydrogen and oxygen
(Solved)
The following is a thermochemical equation for the reaction between hydrogen and oxygen

Calculate the bond energy between the elements in water given that:

Date posted:
October 29, 2019
.
Answers (1)
-
Equal volumes of 1M monobasic acids K and L were each reacted with excess zinc granules.
The table below shows the volumes of the gas produced...
(Solved)
Equal volumes of 1M monobasic acids K and L were each reacted with excess zinc granules.
The table below shows the volumes of the gas produced after two minutes

(a) Explain the difference in the volumes of the gas produced
(b) How can the production of the gas be increased?
Date posted:
October 29, 2019
.
Answers (1)
-
Metal R and S were used to form a cell. The following half equations show the standard electrode potentials of the half cells. (R and...
(Solved)
Metal R and S were used to form a cell. The following half equations show the standard electrode potentials of the half cells. (R and S are not actual symbols of the element)
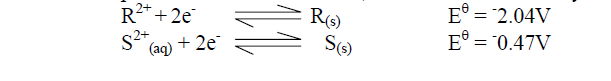
Write the full equation for the cell and calculate the e.m.f
Date posted:
October 29, 2019
.
Answers (1)
-
Explain how you would obtain an insoluble salt XSO4 when you are provided with the following :-
(i) Distilled water
(ii) Solid YSO4 which is soluble in...
(Solved)
Explain how you would obtain an insoluble salt XSO4 when you are provided with the following :-
(i) Distilled water
(ii) Solid YSO4 which is soluble in water
(iii) Solid salt X(NO3)2
Date posted:
October 29, 2019
.
Answers (1)
-
The equation below represents a reaction that takes place in an industrial process
(Solved)
The equation below represents a reaction that takes place in an industrial process
4NH3(g) + 5O2(g)------>6H2O(g) + 4NO(g)
(a) Name the catalyst used
(b) What are the other conditions for the reaction?
(c) Why are the products cooled before being oxidised?
Date posted:
October 29, 2019
.
Answers (1)
-
The graph below represents the volume of gas collected against time when dilute sulphuric acid is reacted with Zinc granules:-
(Solved)
The graph below represents the volume of gas collected against time when dilute sulphuric acid is reacted with Zinc granules:-
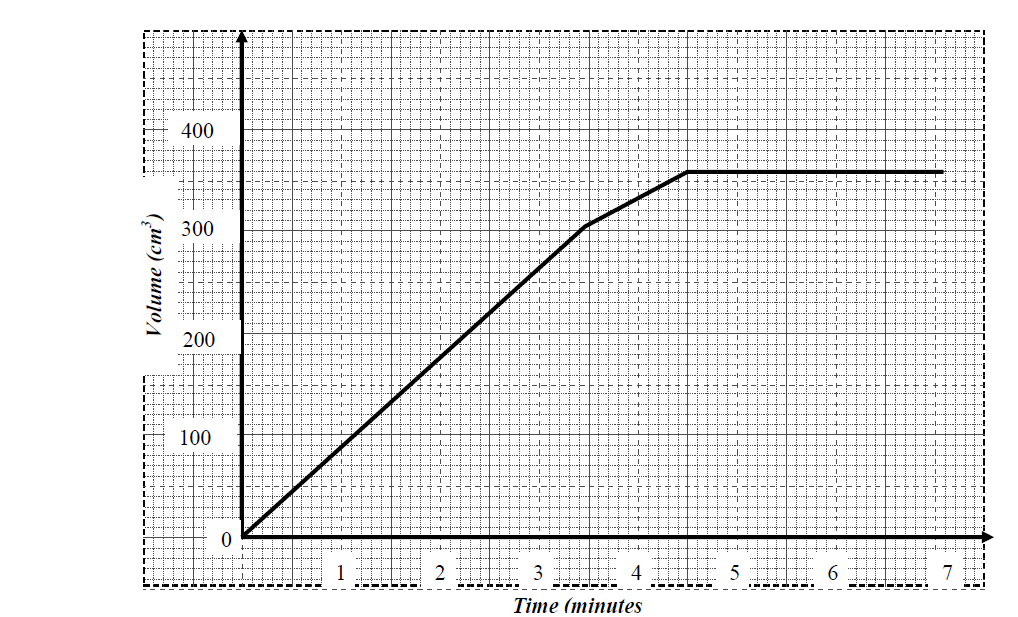
(a) Determine the rate of reaction between the 1st and 3rd minute
(b) When did the reaction stop?
(c) Give a possible reason for the reaction to stop
Date posted:
October 29, 2019
.
Answers (1)
-
The sketch below was obtained when 2g of magnesium was reacted with excess of 2M hydrochloric acid. The volume of hydrogen evolved was then plotted...
(Solved)
The sketch below was obtained when 2g of magnesium was reacted with excess of 2M hydrochloric acid. The volume of hydrogen evolved was then plotted against time as shown below:
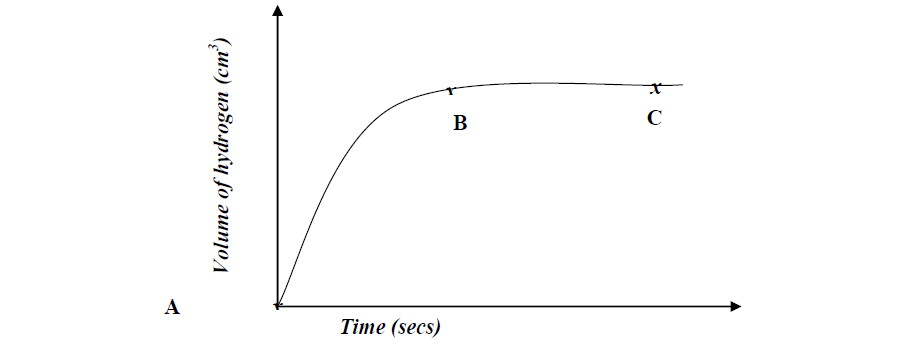
(a) On the same axis plot the graph that would be obtained if 1M hydrochloric acid was used instead of 2M hydrochloric acid. Explain
(b) Explain the significance of the flat portion BC of the curve
Date posted:
October 28, 2019
.
Answers (1)
-
The table below gives bond energies for three covalent bonds
(Solved)
The table below gives bond energies for three covalent bonds

(a) Calculate the energy change for the following reaction:
H2(g) + Cl2(g)------>2HCl(g)
(b) Sketch an energy level diagram for the reaction in (a) above
Date posted:
October 28, 2019
.
Answers (1)
-
The scheme below shows the energy changes that take place between ice, water and steam.
Study it and answer the questions that follow:-
(Solved)
The scheme below shows the energy changes that take place between ice, water and steam.
Study it and answer the questions that follow:-

(a) What name is given to the energy change 
(b) What is the sign  give a reason
Date posted:
October 28, 2019
.
Answers (1)
-
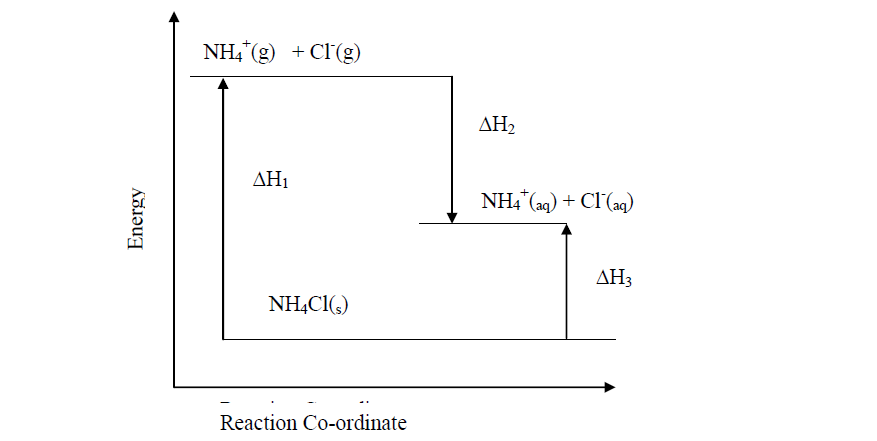
Study the diagram below and answer the questions that follow:
(Solved)
Study the diagram below and answer the questions that follow:
Date posted:
October 28, 2019
.
Answers (1)
-
Iodine can react with chlorine as shown below:-
(Solved)
Iodine can react with chlorine as shown below:-

Determine the molar enthalpy change for this reaction
Date posted:
October 28, 2019
.
Answers (1)
-
The equation below represents changes in the physical state of ions metal:
(Solved)
The equation below represents changes in the physical state of ions metal:

Calculate the amount of heat energy required to change 10kg of solid iron to gaseous iron
Fe = 56
Date posted:
October 28, 2019
.
Answers (1)
-
The setup below was used to investigate the changes that take place when sodium hydroxide pellets dissolve in water.
(Solved)
The setup below was used to investigate the changes that take place when sodium hydroxide pellets dissolve in water.

a) Why is a plastic beaker used instead of a metallic beaker?
b) State and explain the observations made in the above reaction
Date posted:
October 28, 2019
.
Answers (1)
-
Calculate the latent heat of vaporization of water
H2O(l)-------->H2O(g)
(Solved)
Calculate the latent heat of vaporization of water
H2O(l)-------->H2O(g)
Given the following thermo chemical equations:-

Date posted:
October 28, 2019
.
Answers (1)
-
Consider the following equilibrium reaction.
(Solved)
Consider the following equilibrium reaction.

State and explain the effect of formation of hydrogen chloride if pressure was increased in the equation above
Date posted:
October 28, 2019
.
Answers (1)
-
Biogas is a mixture of mainly Carbon (IV) Oxide and methane.
(i) Give a reason why biogas can be used as a fuel
(ii) Other than fractional...
(Solved)
Biogas is a mixture of mainly Carbon (IV) Oxide and methane.
(i) Give a reason why biogas can be used as a fuel
(ii) Other than fractional distillation, describe a method that can be used to determine the percentage of methane in biogas
Date posted:
October 28, 2019
.
Answers (1)
-
A typical electrolysis cell uses a current of 40,000 amperes. Calculate the mass (in Kg of aluminium produced in one hour). (Al = 27) (Faraday...
(Solved)
A typical electrolysis cell uses a current of 40,000 amperes. Calculate the mass (in Kg of aluminium produced in one hour). (Al = 27) (Faraday = 96500 Coloumbs)
Date posted:
October 28, 2019
.
Answers (1)