-
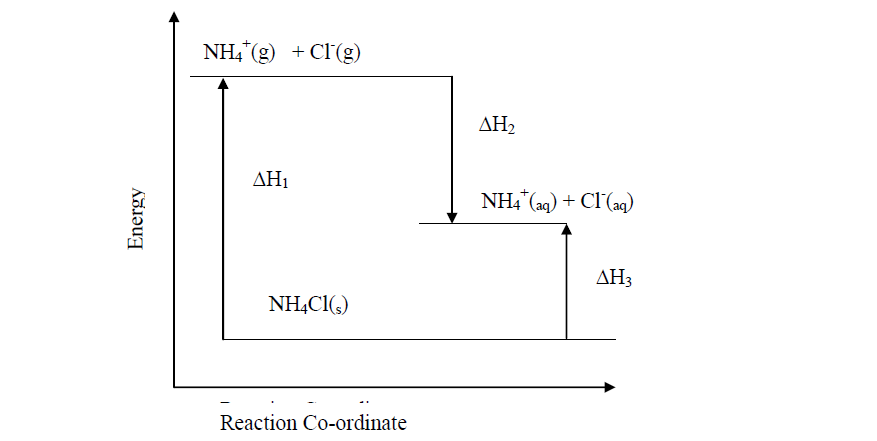
Study the diagram below and answer the questions that follow:
(Solved)
Study the diagram below and answer the questions that follow:
Date posted:
October 28, 2019
.
Answers (1)
-
Iodine can react with chlorine as shown below:-
(Solved)
Iodine can react with chlorine as shown below:-

Determine the molar enthalpy change for this reaction
Date posted:
October 28, 2019
.
Answers (1)
-
The equation below represents changes in the physical state of ions metal:
(Solved)
The equation below represents changes in the physical state of ions metal:

Calculate the amount of heat energy required to change 10kg of solid iron to gaseous iron
Fe = 56
Date posted:
October 28, 2019
.
Answers (1)
-
The setup below was used to investigate the changes that take place when sodium hydroxide pellets dissolve in water.
(Solved)
The setup below was used to investigate the changes that take place when sodium hydroxide pellets dissolve in water.
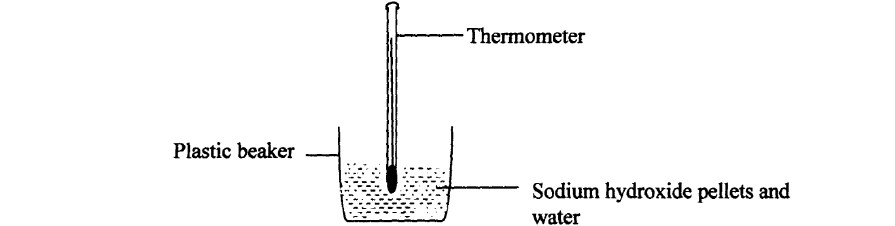
a) Why is a plastic beaker used instead of a metallic beaker?
b) State and explain the observations made in the above reaction
Date posted:
October 28, 2019
.
Answers (1)
-
Biogas is a mixture of mainly Carbon (IV) Oxide and methane.
(i) Give a reason why biogas can be used as a fuel
(ii) Other than fractional...
(Solved)
Biogas is a mixture of mainly Carbon (IV) Oxide and methane.
(i) Give a reason why biogas can be used as a fuel
(ii) Other than fractional distillation, describe a method that can be used to determine the percentage of methane in biogas
Date posted:
October 28, 2019
.
Answers (1)
-
A typical electrolysis cell uses a current of 40,000 amperes. Calculate the mass (in Kg of aluminium produced in one hour). (Al = 27) (Faraday...
(Solved)
A typical electrolysis cell uses a current of 40,000 amperes. Calculate the mass (in Kg of aluminium produced in one hour). (Al = 27) (Faraday = 96500 Coloumbs)
Date posted:
October 28, 2019
.
Answers (1)
-
When 1.6g of ammonium nitrate were dissolved in 100cm3 of water, the temperature dropped by 6ºC. Calculate its enthalpy change. (Density of water = 1g/cm3,specific...
(Solved)
When 1.6g of ammonium nitrate were dissolved in 100cm3 of water, the temperature dropped by 6ºC. Calculate its enthalpy change. (Density of water = 1g/cm3,specific heat capacity is 4.2kJ kg-1K-1)
Date posted:
October 28, 2019
.
Answers (1)
-
Nitrogen and hydrogen react reversibly according to the equation:-
(Solved)
Nitrogen and hydrogen react reversibly according to the equation:-

The energy level diagram for the above reaction is shown below:-
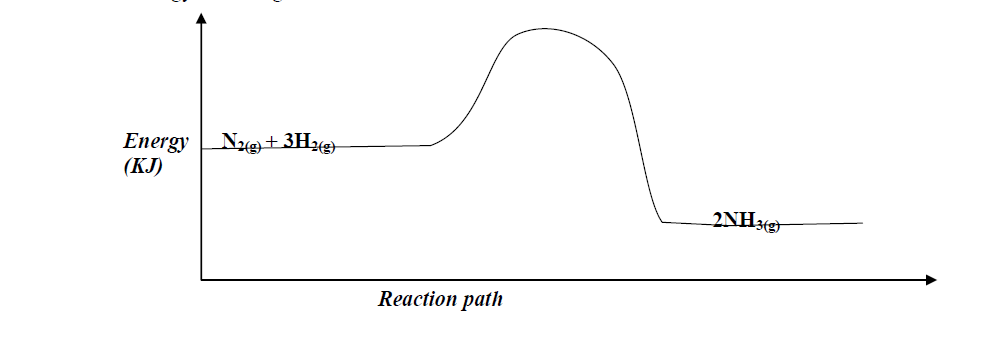
(a) How would the yield of ammonia be affected by:
(i) A decrease in temperature
(ii) An increase in pressure
(b) How does a catalyst affect reversible reaction already in equilibrium?
(c) On the above diagram, sketch the energy level diagram that would be obtained when iron catalyst is added to the reaction
Date posted:
October 28, 2019
.
Answers (1)
-
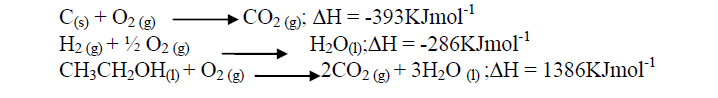
Using the heats of combustion of the following substances, calculate the heat of formation of ethanol
(Solved)
Using the heats of combustion of the following substances, calculate the heat of formation of ethanol
Date posted:
October 28, 2019
.
Answers (1)
-
The heat of combustion of ethanol, C2H5OH is 1370KJ/mole.
(i) What is meant by heat of combustion?
(ii) Calculate the heating value of ethanol
(H = 1.0, C...
(Solved)
The heat of combustion of ethanol, C2H5OH is 1370KJ/mole.
(i) What is meant by heat of combustion?
(ii) Calculate the heating value of ethanol
(H = 1.0, C = 12.0, O = 16.0)
Date posted:
October 25, 2019
.
Answers (1)
-
6g of Potassium nitrate solid was added to 120cm3 of water in a plastic beaker.
The mixture was stirred gently and the following results were obtained.
Initial...
(Solved)
6g of Potassium nitrate solid was added to 120cm3 of water in a plastic beaker.
The mixture was stirred gently and the following results were obtained.
Initial temperature = 21.50C
Final temperature = 17.0 0C
(a) Calculate the enthalpy change for the reaction
(Density =1g/cm3, C= 4.2jg-1K-1)
(b) Calculate the molar enthalpy change for the dissolution of potassium nitrate
(K=39, N= 14, O =16)
Date posted:
October 25, 2019
.
Answers (1)
-
How does the pH value of 0.25M KOH(aq) compare with that of 0.25M ammonia solution?
(Solved)
How does the pH value of 0.25M KOH(aq) compare with that of 0.25M ammonia solution?
Date posted:
October 25, 2019
.
Answers (1)
-
A solution of hydrogen chloride gas in methylbenzene has no effect on calcium carbonate.
A solution of hydrogen chloride in water reacts with calcium carbonate to...
(Solved)
A solution of hydrogen chloride gas in methylbenzene has no effect on calcium carbonate.
A solution of hydrogen chloride in water reacts with calcium carbonate to produce a gas. Explain
Date posted:
October 25, 2019
.
Answers (1)
-
The table shows solubility of potassium chlorate V
(Solved)
The table shows solubility of potassium chlorate V
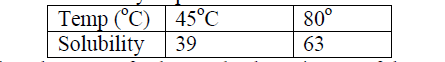
(a) Calculate the mass of solute and solvent in 90g of the saturated solution of the salt at 45oC
(b) A solution of the salt in 100g water contains 63g at 95oC. At what temperature will the solution start forming crystals when cooled
Date posted:
October 25, 2019
.
Answers (1)
-
Describe how you would prepare a dry sample of crystals of potassium sulphate starting with 100cm3 of 1M sulphuric (VI) acid.
(Solved)
Describe how you would prepare a dry sample of crystals of potassium sulphate starting with 100cm3 of 1M sulphuric (VI) acid.
Date posted:
October 25, 2019
.
Answers (1)
-
In an experiment to determine solubility of sodium chloride, 10.0 cm3 of a saturated solution of sodium chloride weighing 10.70g were placed in a volumetric...
(Solved)
In an experiment to determine solubility of sodium chloride, 10.0 cm3 of a saturated solution of sodium chloride weighing 10.70g were placed in a volumetric flask and diluted to a total of 500cm3. 25.0 cm3 of the diluted solution of sodium chloride reacted completely with 24.0 cm3 of 0.1M silver nitrate solution.

I. Calculate;
(i) Moles of silver nitrate in 24.0 cm3 of solution.
(ii) Moles of NaCl in 25.0 cm3 of solution.
(iii) Moles of NaCl in 500 cm3 of solution.
(iv) Mass of NaCl in 10.0 cm3 of saturated sodium chloride (Na = 23, Cl = 35.5)
(v) Mass of water in 10.0cm3 of saturated solution.
(vi) The solubility of NaCl in g/100g of waters.
Date posted:
October 25, 2019
.
Answers (1)
-
Calculate the solubility of salt given that 15g of the salt can saturate 25cm3 of water
(Solved)
Calculate the solubility of salt given that 15g of the salt can saturate 25cm3 of water
Date posted:
October 25, 2019
.
Answers (1)
-
The solubility of Iron (II) Sulphate crystals are 22oC is 15.65g per 100g of water. Calculate the mass of iron(II) sulphate crystals in 45g of...
(Solved)
The solubility of Iron (II) Sulphate crystals at 22oC is 15.65g per 100g of water. Calculate the mass of iron(II) sulphate crystals in 45g of saturated solution at the same temperature
Date posted:
October 25, 2019
.
Answers (1)
-
In an attempt to prepare a gas, Sabulei added concentrated hydrochloric acid to Potassium manganate. The products were then passed through two wash bottles containing...
(Solved)
In an attempt to prepare a gas, Sabulei added concentrated hydrochloric acid to Potassium manganate. The products were then passed through two wash bottles containing water and concentrated sulphuric acid
(a) Name the gas prepared
(b) Name the purpose of wash bottle:
(i) Containing water
(ii) Containing concentrated sulphuric acid
Date posted:
October 25, 2019
.
Answers (1)
-
The figure below was set by a student to investigate the reaction between chlorine gas and hydrogen gas:
(Solved)
The figure below was set by a student to investigate the reaction between chlorine gas and hydrogen gas:
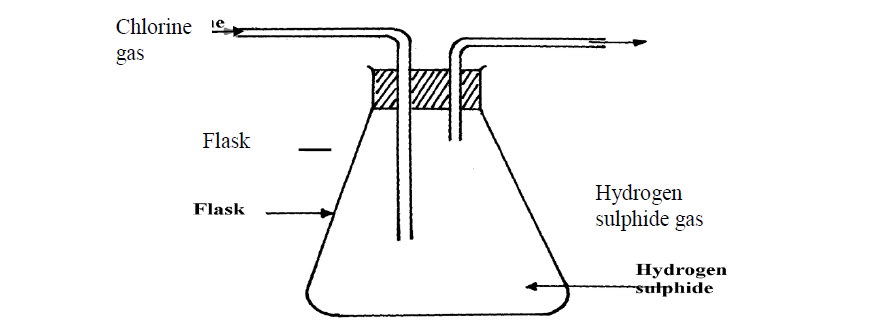
(a) Write an equation for the reaction that took place in the flask
(b) What observation was made in the flask?
(c) What precaution should be taken in carrying out the experiment?
Date posted:
October 24, 2019
.
Answers (1)