a) Cooling
b) Latent heat of fusion
johnmulu answered the question on April 6, 2017 at 07:23
-
The graph below shows a curve obtained when water at 20o was heated for 15 minutes.
(Solved)
The graph below shows a curve obtained when water at 20o was heated for 15 minutes.
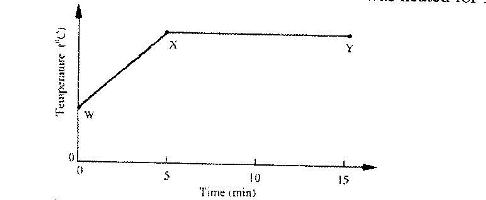
a) What happens to the water molecules between points W and X?
b) In which part of the curve does a change of state occur?
c) Explain why the temperature does not rise between points X and Y.
Date posted:
April 6, 2017
.
Answers (1)
-
A piece of chromatography paper was spotted with coloured inks obtained from pens labeled 1 to 6. The diagram below show the spots after the chromatogram was developed.
(Solved)
A piece of chromatography paper was spotted with coloured inks obtained from pens labeled 1 to 6. The diagram below show the spots after the chromatogram was developed.
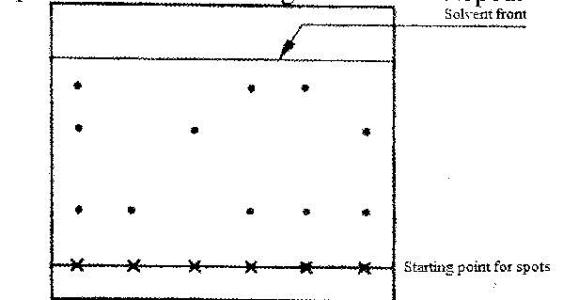
a) Which two pens contained the same pigment?
b) Which pens contained only one pigment?
c) According to the chromatogram, which pigment are present in the ink of pen number 6?
Date posted:
April 5, 2017
.
Answers (1)
-
The set-Up below represents the apparatus that may be used to separate a mixture of two miscible liquids C and D whose boiling points are 80oC and 110oC.
(Solved)
The set-Up below represents the apparatus that may be used to separate a mixture of two miscible liquids C and D whose boiling points are 80oC and 110oC.
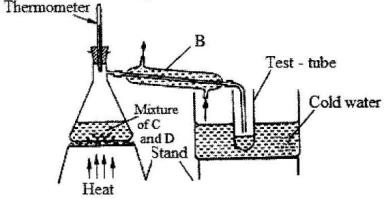
a) Name B
b) What is the purpose of the thermometer?
c) Which liquid was collected in the test tube?
Date posted:
April 5, 2017
.
Answers (1)
-
The diagram below shows the relationships between the physical state of matter. Study it and answer the questions that follow.
(Solved)
The diagram below shows the relationships between the physical state of matter. Study it and answer the questions that follow.
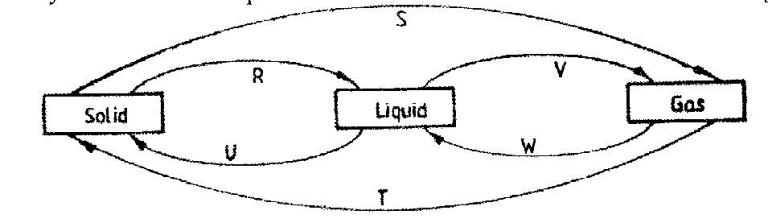
a) Identify the processes R, V, W and U.
b) Name one substance which can undergo the process represented by S and T
c) Explain whether process W is exothermic or endothermic
Date posted:
April 5, 2017
.
Answers (1)
-
In an experiment to separate a mixture of two organic liquids, Liquid M (b.p 56oC) and liquid N (b.p.118oC), a student set up the apparatus shown below
(Solved)
In an experiment to separate a mixture of two organic liquids, Liquid M (b.p 56oC) and liquid N (b.p.118oC), a student set up the apparatus shown below
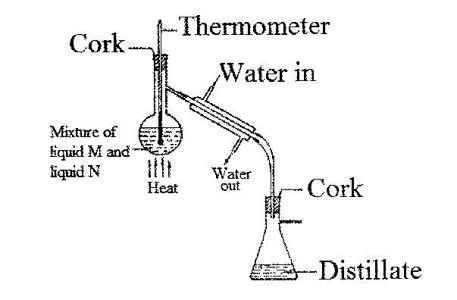
a) Identify two mistakes in the set-up.
b) What method would the student use to test the purity of the distillates obtained?
Date posted:
April 5, 2017
.
Answers (1)
-
The curve below represents the variation of temperature with time pure and impure samples of a solid were heated separately.
(Solved)
The curve below represents the variation of temperature with time pure and impure samples of a solid were heated separately.
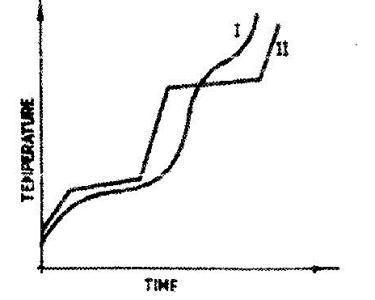
Which curve shows the variation in temperature for pure solid? Explain.
Date posted:
April 5, 2017
.
Answers (1)
-
An alkanol has the following composition by mass: Hydrogen 13.5%, oxygen 21.6% and carbon 64.9%
Determine the empirical formula of the alkanol (C = 12.0: H = 1.0; O = 16.0)
(Solved)
An alkanol has the following composition by mass: Hydrogen 13.5%, oxygen 21.6% and carbon 64.9%
Determine the empirical formula of the alkanol (C = 12.0: H = 1.0; O = 16.0)
Date posted:
February 22, 2017
.
Answers (1)
-
Two organic compounds P and Q decolourise acidified potassium manganate (VII) solution, but only P reacts with sodium metal to give a colourless gas.
(Solved)
Two organic compounds P and Q decolourise acidified potassium manganate (VII) solution, but only P reacts with sodium metal to give a colourless gas. Which homologous series does compound P belong? Give a reason.
Date posted:
February 22, 2017
.
Answers (1)
-
Explain why the solubility of ethane in water is lower than of ethanol
(Solved)
Explain why the solubility of ethane in water is lower than of ethanol
Date posted:
February 22, 2017
.
Answers (1)
-
Some animal and vegetable oils are used to make margarine and soap. Give the reagent and conditions necessary for converting the oils into:
(Solved)
Some animal and vegetable oils are used to make margarine and soap. Give the reagent and conditions necessary for converting the oils into:
a) Margarine
b) Soap.
Date posted:
February 22, 2017
.
Answers (1)
-
Explain why the boiling point of ethanol is higher than that of hexane
(Solved)
Explain why the boiling point of ethanol is higher than that of hexane (Relative molecular mass of ethanol is 46 while that of hexane is 86)
Date posted:
February 21, 2017
.
Answers (1)
-
The boiling point of ethanol, propanol and butanol are 78oC, 97.2oC and 117o
(Solved)
The boiling point of ethanol, propanol and butanol are 78oC, 97.2oC and 117oC. Explain this trend
Date posted:
February 21, 2017
.
Answers (1)
-
Pentane and ethanol are miscible. Describe how water could be used to separate a mixture of pentane and ethanol
(Solved)
Pentane and ethanol are miscible. Describe how water could be used to separate a mixture of pentane and ethanol
Date posted:
February 21, 2017
.
Answers (1)
-
State the observation that would be made when a piece of sodium metal is placed in samples of:
(Solved)
State the observation that would be made when a piece of sodium metal is placed in samples of:
i) Pentane
ii) Pentanol
Date posted:
February 21, 2017
.
Answers (1)
-
a) Name the raw material from which sodium is extracted.
b) Give a reason why sodium is extracted using electrolysis
c) Give two reasons of sodium metal
(Solved)
a) Name the raw material from which sodium is extracted.
b) Give a reason why sodium is extracted using electrolysis
c) Give two reasons of sodium metal
Date posted:
February 21, 2017
.
Answers (1)
-
Aluminium is both malleable and ductile....
(Solved)
Aluminium is both malleable and ductile
a) What is meant by?
i) Malleable
ii) Ductible
b) State one use of alumunium based on:
i) Malleability
ii) Ductility
Date posted:
February 21, 2017
.
Answers (1)
-
a) Explain why the metals magnesium and aluminium are good conductors of electricity
b) Other than cost, give two reasons why aluminium is used for making electric cables while magnesium is not.
(Solved)
a) Explain why the metals magnesium and aluminium are good conductors of electricity
b) Other than cost, give two reasons why aluminium is used for making electric cables while magnesium is not.
Date posted:
February 21, 2017
.
Answers (1)
-
When the oxide of element H was heated with element H was heated with powdered carbon the mixture glowed and carbon (IV) oxide was formed. When the experiment was repeated using the oxide of element J, there was no apparent reaction.
(Solved)
When the oxide of element H was heated with element H was heated with powdered carbon the mixture glowed and carbon (IV) oxide was formed. When the experiment was repeated using the oxide of element J, there was no apparent reaction.
a) Suggest one method that can be used to extract element J from its oxide
b) Arrange the elements H, J and carbon in the order of their decreasing reactivity.
Date posted:
February 21, 2017
.
Answers (1)
-
Aluminium metal is a good conductor and is used for overhead cables. State any other two properties that make aluminium suitable for this use.
(Solved)
Aluminium metal is a good conductor and is used for overhead cables. State any other two properties that make aluminium suitable for this use.
Date posted:
February 21, 2017
.
Answers (1)
-
State one advantage and one disadvantage of using petrol containing tetraethyl lead in motor vehicles
(Solved)
Give one advantage and one disadvantage of using petrol containing tetraethyl lead in motor vehicles
Date posted:
February 21, 2017
.
Answers (1)