(i) The milliameter deflects to maximum then falls back to zero.
(ii) Current flows when the capacitor is charging. When fully charged, no current flows and potential difference (p.d) is equal to charging voltage
johnmulu answered the question on May 27, 2017 at 06:42
-
Figure 3 shows a voltmeter connected across two charged parallel plates.
(Solved)
Figure 3 shows a voltmeter connected across two charged parallel plates.
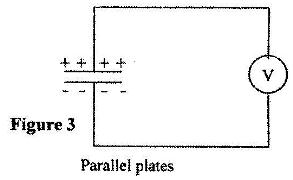
When a thin sheet of mica is inserted between the plates, the voltmeter reading is observed to reduce. Explain this observation.
Date posted:
May 27, 2017
.
Answers (1)
-
Figure 7 shows a "windmill" which when connected to the dome of a positively charged Van de Graff generator is observed to rotate as indicated. A, B, C and D are sharp points.
(Solved)
Figure 7 shows a "windmill" which when connected to the dome of a positively charged Van de Graff generator is observed to rotate as indicated. A, B, C and D are sharp points.
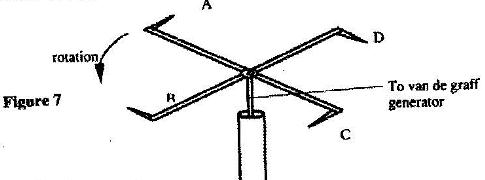
Explain how this rotation is caused.
Date posted:
May 26, 2017
.
Answers (1)
-
Figure 7 shows a sharp pin fixed on a cap of leaf electroscope. The electroscope is highly charged and then left for some time.
(Solved)
Figure 7 shows a sharp pin fixed on a cap of leaf electroscope. The electroscope is highly charged and then left for some time.
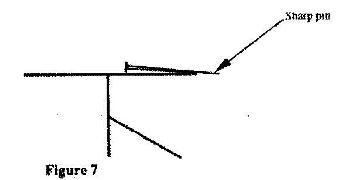
Explain why the leaf collapses.
Date posted:
May 26, 2017
.
Answers (1)
-
In an experiment to observe interference of light waves a double slit is placed close to the source. See Fig. 3
(Solved)
In an experiment to observe interference of light waves a double slit is placed close to the source. See Fig. 3
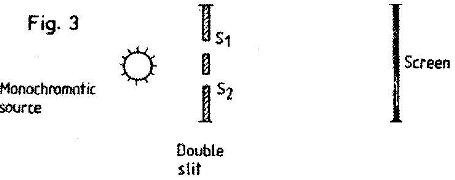
(i) State the function of the double slit.
(ii) Describe what is observed on the screen.
Date posted:
May 26, 2017
.
Answers (1)
-
Figure 9 shows the graph of the relationship between current I and potential difference V for two tungsten filament lamps X and Y. The normal working voltages for the lamp X and lamp Y are 2.5 V and 3.0 V respectively.
(Solved)
Figure 9 shows the graph of the relationship between current I and potential difference V for two tungsten filament lamps X and Y. The normal working voltages for the lamp X and lamp Y are 2.5 V and 3.0 V respectively.
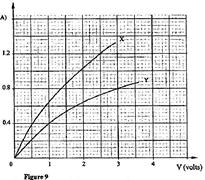
(a) Explain the change in the shape of the curves as the current increases.
(b) Determine the resistance of the lamps X at the normal working voltage.
(c) The lamps are now connected in a series circuit in which a current of 0.4 A flows. Find the potential differences across lamp Y.
Date posted:
May 23, 2017
.
Answers (1)
-
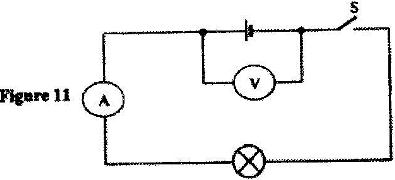
In figure 11 the voltmeter reads 2.1 V when the switch is open. When the switch is closed, the voltmeter reads 1.8 V and the ammeter reads 0.1 A.
(Solved)
In figure 11 the voltmeter reads 2.1 V when the switch is open. When the switch is closed, the voltmeter reads 1.8 V and the ammeter reads 0.1 A.
 ()
()
Determine:
(i) The e.m.f of the cell.
(ii) The internal resistance of the cell.
(iii) The resistance of the lamp.
Date posted:
May 23, 2017
.
Answers (1)
-
The cell in Figure 10 has an e.m.f of 2.1 V and negligible internal resistance.
(Solved)
The cell in Figure 10 has an e.m.f of 2.1 V and negligible internal resistance.
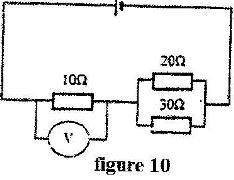
Determine the
(i) Total resistance in the circuit
(ii) Current in the circuit
(iii) Reading of the voltmeter
Date posted:
May 23, 2017
.
Answers (1)
-
Figure 4 shows an electrical circuit. When the switch is closed the ammeter reading is 0.3 A.
(Solved)
Figure 4 shows an electrical circuit. When the switch is closed the ammeter reading is 0.3 A.
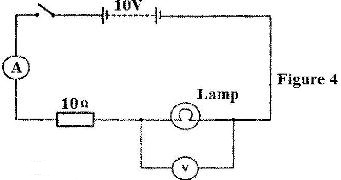
Determine the voltmeter reading.
Date posted:
May 23, 2017
.
Answers (1)
-
The diagram in Fig. 2 represent an electric circuit in which five resistors are connected to be a battery of e.m.f. 4.0 V and of negligible internal resistance.
(Solved)
The diagram in Fig. 2 represent an electric circuit in which five resistors are connected to be a battery of e.m.f. 4.0 V and of negligible internal resistance.
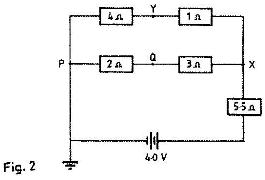
Determine:
(i) The current flowing through the 5.5 resistor
(ii) The potential difference between Y and Q.
Date posted:
May 23, 2017
.
Answers (1)
-
Figure 10 shows a trolley of weight 20 N pulled by a force of 4 N from the bottom to the top of an inclined plane at a uniform speed.
(Solved)
Figure 10 shows a trolley of weight 20 N pulled by a force of 4 N from the bottom to the top of an inclined plane at a uniform speed.
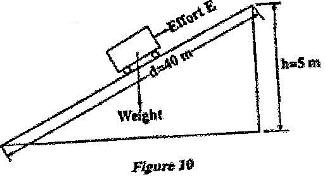
(i) State the value of the force acting downwards along the inclined plane.
(ii) Explain how the value in part (a)(i) is obtained.
Date posted:
May 16, 2017
.
Answers (1)
-
Figure 10 shows a pulley system used to raise a load by applying an effort of 500 N
(Solved)
Figure 10 shows a pulley system used to raise a load by applying an effort of 500 N
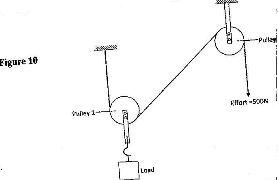
State the:
(i) Velocity ratio of the system.
(ii) Purpose of pulley 2.
(iii) Given that the machine has an efficiency of 80%, determine the maximum load that can be raised.
Date posted:
May 16, 2017
.
Answers (1)
-
Figure 16 shows a screw jack whose screw has a pitch of 1 mm, and has a handle of 25 cm long.
(Solved)
Figure 16 shows a screw jack whose screw has a pitch of 1 mm, and has a handle of 25 cm long.
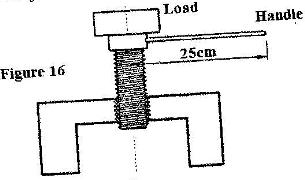
Determine the velocity ratio of the jack.
Date posted:
May 16, 2017
.
Answers (1)
-
Figure 7 shows a mass of 30 kg being pulled from point P to point Q, with a force of 200 N parallel
(Solved)
Figure 7 shows a mass of 30 kg being pulled from point P to point Q, with a force of 200 N parallel to an inclined plane. The distance between P and Q is 22.5 m. In being moved from P and Q the mass is raised through a vertical height of 7.5 m.
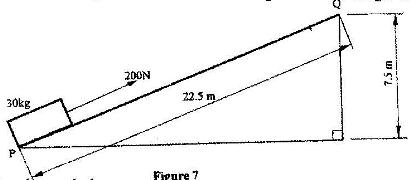 Determine the work done:
(I) By the force;
(II) On the mass;
(III) To overcome friction.
Date posted:
May 16, 2017
.
Answers (1)
-
Figure 5 shows two pulley systems being used to raise different loads. The pulleys are identical.
(Solved)
Figure 5 shows two pulley systems being used to raise different loads. The pulleys are identical.
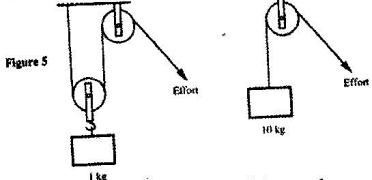
State one reason why system B may have a higher efficiency than system A.
Date posted:
May 16, 2017
.
Answers (1)
-
Two identical spherical steel balls are released from the top of two tall jars containing liquids L1 and L2 respectively. Figure 3 shows the velocity-time graph of the motion of the balls.
(Solved)
Two identical spherical steel balls are released from the top of two tall jars containing liquids L1 and L2 respectively. Figure 3 shows the velocity-time graph of the motion of the balls.
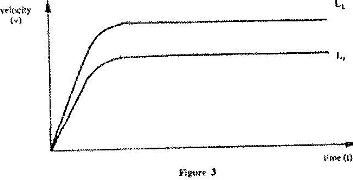
Explain the nature of the curves and state why they are different.
Date posted:
May 16, 2017
.
Answers (1)
-
Figure 9 shows graph of velocity against time for a ball bearing released at the surface of viscous liquid.
(Solved)
Figure 9 shows graph of velocity against time for a ball bearing released at the surface of viscous liquid.
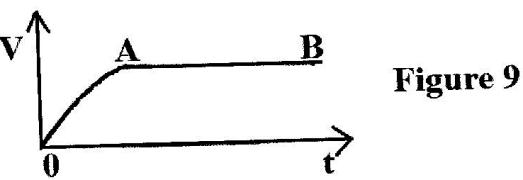
Explain the motion of the ball bearing for parts.
(i) OA
(ii) AB
Date posted:
May 15, 2017
.
Answers (1)
-
Figure 9 shows a velocity-time graph for the motion of a certain body.
(Solved)
Figure 9 shows a velocity-time graph for the motion of a certain body.
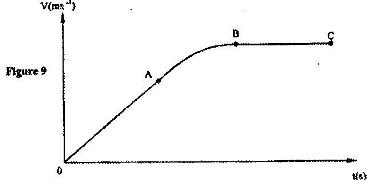
Describe the motion of the body in the region;
(i) OA; (ii) AB; (iii) BC;
Date posted:
May 15, 2017
.
Answers (1)
-
Figure 5 shows air flowing through a pipe of different cross-sectional areas. Two pipes A and B are dipped into water.
(Solved)
Figure 5 shows air flowing through a pipe of different cross-sectional areas. Two pipes A and B are dipped into water.
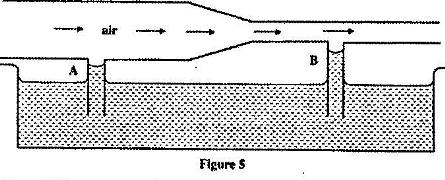
Explain the cause of the difference in the levels of water in the pipes A and B.
Date posted:
May 15, 2017
.
Answers (1)
-
Figure 6 shows two inflated balloons hanging vertically on light threads.
(Solved)
Figure 6 shows two inflated balloons hanging vertically on light threads.
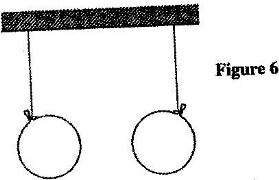
When a stream of air is blown in the space between the balloons, they are observed to move towards each other. Explain this observation
Date posted:
May 15, 2017
.
Answers (1)
-
Figure 12 shows a displacement - time graph for a progressive wave
(Solved)
Figure 12 shows a displacement - time graph for a progressive wave
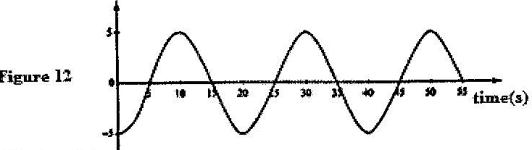
i) State the amplitude of the wave
ii) Determine the frequency of the wave.
Date posted:
April 19, 2017
.
Answers (1)