(a) Substance changes from solid to liquid state.
(b) Substance changes from liquid to gaseous state.
johnmulu answered the question on May 27, 2017 at 09:16
-
Figure 4 shows a graph of temperature against time when pure melting ice at 0oC is heated uniformly.
(Solved)
Figure 4 shows a graph of temperature against time when pure melting ice at 0oC is heated uniformly.
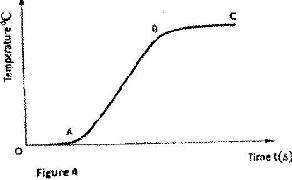
Explain what happens between parts:
(i) OA
(ii) AB
Date posted:
May 27, 2017
.
Answers (1)
-
Figure 11 shows the features of a domestic refrigerator. A volatile liquid circulates through the capillary tubes under the action of the compression pump.
(Solved)
Figure 11 shows the features of a domestic refrigerator. A volatile liquid circulates through the capillary tubes under the action of the compression pump.
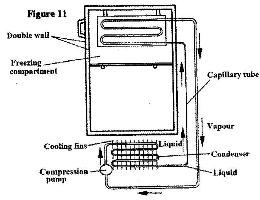
(i) State the reaction for using a volatile liquid.
(ii) what is the purpose of double wall?
Date posted:
May 27, 2017
.
Answers (1)
-
Figure 9, shows a circuit that may be used to charge a capacitor.
(Solved)
Figure 9, shows a circuit that may be used to charge a capacitor.
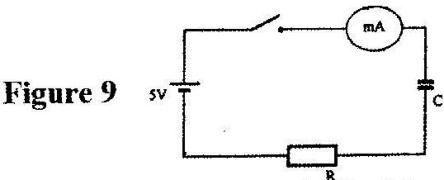
(i) State the observation on the milliameter when the circuit is switched on.
(ii) Explain the observation in (i) above.
Date posted:
May 27, 2017
.
Answers (1)
-
Figure 3 shows a voltmeter connected across two charged parallel plates.
(Solved)
Figure 3 shows a voltmeter connected across two charged parallel plates.
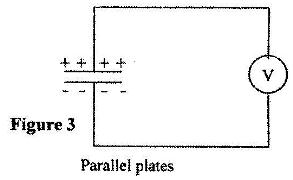
When a thin sheet of mica is inserted between the plates, the voltmeter reading is observed to reduce. Explain this observation.
Date posted:
May 27, 2017
.
Answers (1)
-
Figure 7 shows a "windmill" which when connected to the dome of a positively charged Van de Graff generator is observed to rotate as indicated. A, B, C and D are sharp points.
(Solved)
Figure 7 shows a "windmill" which when connected to the dome of a positively charged Van de Graff generator is observed to rotate as indicated. A, B, C and D are sharp points.
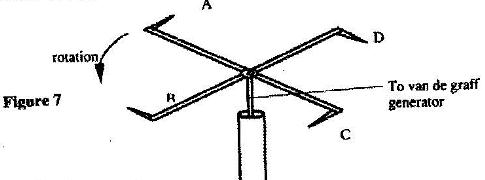
Explain how this rotation is caused.
Date posted:
May 26, 2017
.
Answers (1)
-
Figure 7 shows a sharp pin fixed on a cap of leaf electroscope. The electroscope is highly charged and then left for some time.
(Solved)
Figure 7 shows a sharp pin fixed on a cap of leaf electroscope. The electroscope is highly charged and then left for some time.
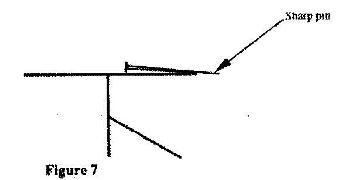
Explain why the leaf collapses.
Date posted:
May 26, 2017
.
Answers (1)
-
In an experiment to observe interference of light waves a double slit is placed close to the source. See Fig. 3
(Solved)
In an experiment to observe interference of light waves a double slit is placed close to the source. See Fig. 3
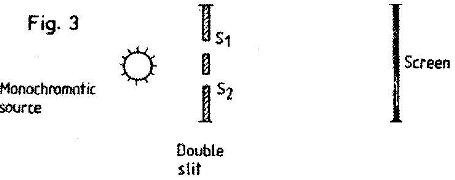
(i) State the function of the double slit.
(ii) Describe what is observed on the screen.
Date posted:
May 26, 2017
.
Answers (1)
-
Figure 9 shows the graph of the relationship between current I and potential difference V for two tungsten filament lamps X and Y. The normal working voltages for the lamp X and lamp Y are 2.5 V and 3.0 V respectively.
(Solved)
Figure 9 shows the graph of the relationship between current I and potential difference V for two tungsten filament lamps X and Y. The normal working voltages for the lamp X and lamp Y are 2.5 V and 3.0 V respectively.
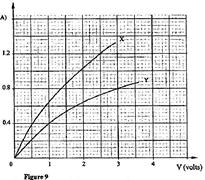
(a) Explain the change in the shape of the curves as the current increases.
(b) Determine the resistance of the lamps X at the normal working voltage.
(c) The lamps are now connected in a series circuit in which a current of 0.4 A flows. Find the potential differences across lamp Y.
Date posted:
May 23, 2017
.
Answers (1)
-
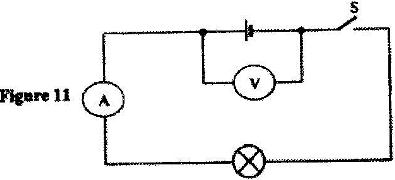
In figure 11 the voltmeter reads 2.1 V when the switch is open. When the switch is closed, the voltmeter reads 1.8 V and the ammeter reads 0.1 A.
(Solved)
In figure 11 the voltmeter reads 2.1 V when the switch is open. When the switch is closed, the voltmeter reads 1.8 V and the ammeter reads 0.1 A.
 ()
()
Determine:
(i) The e.m.f of the cell.
(ii) The internal resistance of the cell.
(iii) The resistance of the lamp.
Date posted:
May 23, 2017
.
Answers (1)
-
The cell in Figure 10 has an e.m.f of 2.1 V and negligible internal resistance.
(Solved)
The cell in Figure 10 has an e.m.f of 2.1 V and negligible internal resistance.
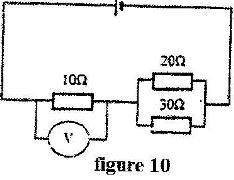
Determine the
(i) Total resistance in the circuit
(ii) Current in the circuit
(iii) Reading of the voltmeter
Date posted:
May 23, 2017
.
Answers (1)
-
Figure 4 shows an electrical circuit. When the switch is closed the ammeter reading is 0.3 A.
(Solved)
Figure 4 shows an electrical circuit. When the switch is closed the ammeter reading is 0.3 A.
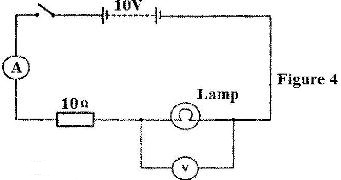
Determine the voltmeter reading.
Date posted:
May 23, 2017
.
Answers (1)
-
The diagram in Fig. 2 represent an electric circuit in which five resistors are connected to be a battery of e.m.f. 4.0 V and of negligible internal resistance.
(Solved)
The diagram in Fig. 2 represent an electric circuit in which five resistors are connected to be a battery of e.m.f. 4.0 V and of negligible internal resistance.
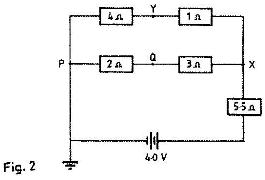
Determine:
(i) The current flowing through the 5.5 resistor
(ii) The potential difference between Y and Q.
Date posted:
May 23, 2017
.
Answers (1)
-
Figure 10 shows a trolley of weight 20 N pulled by a force of 4 N from the bottom to the top of an inclined plane at a uniform speed.
(Solved)
Figure 10 shows a trolley of weight 20 N pulled by a force of 4 N from the bottom to the top of an inclined plane at a uniform speed.
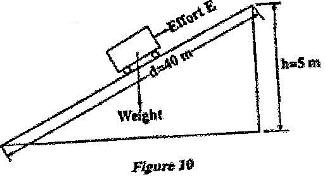
(i) State the value of the force acting downwards along the inclined plane.
(ii) Explain how the value in part (a)(i) is obtained.
Date posted:
May 16, 2017
.
Answers (1)
-
Figure 10 shows a pulley system used to raise a load by applying an effort of 500 N
(Solved)
Figure 10 shows a pulley system used to raise a load by applying an effort of 500 N
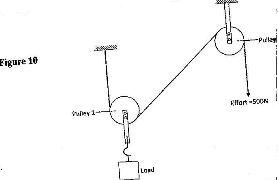
State the:
(i) Velocity ratio of the system.
(ii) Purpose of pulley 2.
(iii) Given that the machine has an efficiency of 80%, determine the maximum load that can be raised.
Date posted:
May 16, 2017
.
Answers (1)
-
Figure 16 shows a screw jack whose screw has a pitch of 1 mm, and has a handle of 25 cm long.
(Solved)
Figure 16 shows a screw jack whose screw has a pitch of 1 mm, and has a handle of 25 cm long.
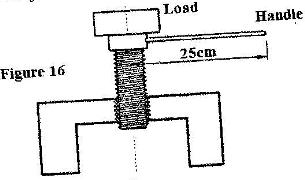
Determine the velocity ratio of the jack.
Date posted:
May 16, 2017
.
Answers (1)
-
Figure 7 shows a mass of 30 kg being pulled from point P to point Q, with a force of 200 N parallel
(Solved)
Figure 7 shows a mass of 30 kg being pulled from point P to point Q, with a force of 200 N parallel to an inclined plane. The distance between P and Q is 22.5 m. In being moved from P and Q the mass is raised through a vertical height of 7.5 m.
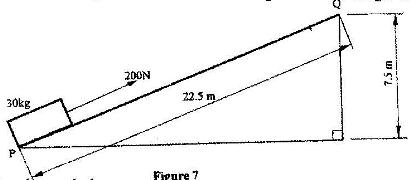 Determine the work done:
(I) By the force;
(II) On the mass;
(III) To overcome friction.
Date posted:
May 16, 2017
.
Answers (1)
-
Figure 5 shows two pulley systems being used to raise different loads. The pulleys are identical.
(Solved)
Figure 5 shows two pulley systems being used to raise different loads. The pulleys are identical.
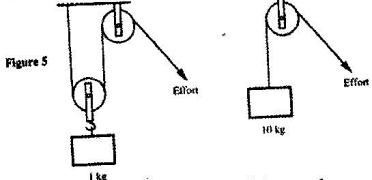
State one reason why system B may have a higher efficiency than system A.
Date posted:
May 16, 2017
.
Answers (1)
-
Two identical spherical steel balls are released from the top of two tall jars containing liquids L1 and L2 respectively. Figure 3 shows the velocity-time graph of the motion of the balls.
(Solved)
Two identical spherical steel balls are released from the top of two tall jars containing liquids L1 and L2 respectively. Figure 3 shows the velocity-time graph of the motion of the balls.
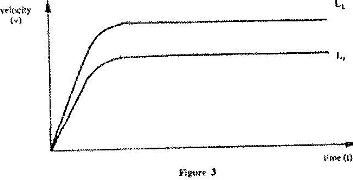
Explain the nature of the curves and state why they are different.
Date posted:
May 16, 2017
.
Answers (1)
-
Figure 9 shows graph of velocity against time for a ball bearing released at the surface of viscous liquid.
(Solved)
Figure 9 shows graph of velocity against time for a ball bearing released at the surface of viscous liquid.
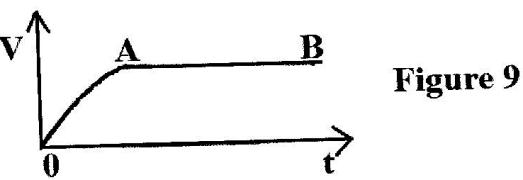
Explain the motion of the ball bearing for parts.
(i) OA
(ii) AB
Date posted:
May 15, 2017
.
Answers (1)
-
Figure 9 shows a velocity-time graph for the motion of a certain body.
(Solved)
Figure 9 shows a velocity-time graph for the motion of a certain body.
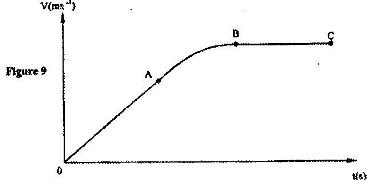
Describe the motion of the body in the region;
(i) OA; (ii) AB; (iii) BC;
Date posted:
May 15, 2017
.
Answers (1)