-
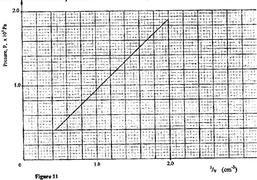
The pressure acting on a gas in a cylinder was changed steadily while the temperature of the gas was maintained constant. The value of volume V of the gas was measured for various values of pressure. The graph in Figure 11 shows the relation between the pressure P, and the reciprocal of volume, $\frac{1}{V}$
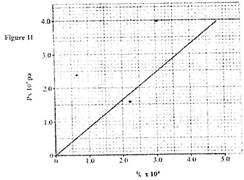 (i) Suggest how the temperature of the gas could be kept constant.
(ii) What physical quantity does K represent?
(iii) State one precaution you would take when performing such an experiment.
(i) Suggest how the temperature of the gas could be kept constant.
(ii) What physical quantity does K represent?
(iii) State one precaution you would take when performing such an experiment.
Date posted:
May 29, 2017
-
The tube is now held in a vertical position with the open end facing upwards as shown in figure 8.
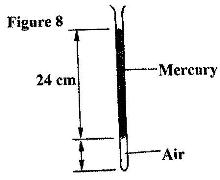 Determine:
(i) The pressure of the enclosed air.
(ii) The length (l) of the enclosed air column.
Determine:
(i) The pressure of the enclosed air.
(ii) The length (l) of the enclosed air column.
Date posted:
May 29, 2017
-
Figure 7 shows a horizontal tube containing air trapped by a mercury thread of length 24 cm. The length of the enclosed air column is 15 cm, The atmospheric pressure is 76 cmHg.
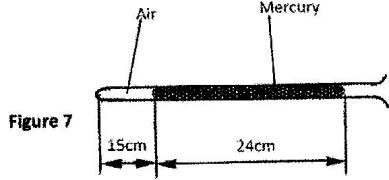 State the pressure of the enclosed air.
Date posted:
May 29, 2017
-
Figure 6 shows a graph of volume against temperature for a given mass of gas.
 Use the graph to determine the absolute zero temperature in oC
Date posted:
May 29, 2017
-
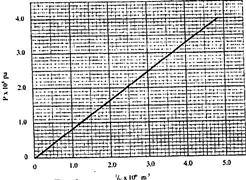
An air bubble is released at the bottom of a tall jar containing a liquid. The height of the liquid column is 80 cm. The volume of the bubble increases from 0.5 cm3 at the bottom of the liquid to 1.15 cm3 at the top. Figure 11 shows the variation of pressure, P, on the bubble with the reciprocal of volume, $\frac{1}{5}$, as it rises in the liquid.
 (i) State the reason why the volume increases as the bubble rises in the liquid column.
(ii) From the graph, determine the pressure on the bubble:
(I) at the bottom of the liquid column;
(II) at the top of liquid column
(i) State the reason why the volume increases as the bubble rises in the liquid column.
(ii) From the graph, determine the pressure on the bubble:
(I) at the bottom of the liquid column;
(II) at the top of liquid column
Date posted:
May 29, 2017
-
The graph in Figure 11 shows the relationship between volume and temperature for the experiment.
 (i) What was the volume of the gas at 0o?
(ii) At what temperature would the volume of the gas be zero?
(iii) Explain why the temperature in part (ii) above cannot be achieved.
(i) What was the volume of the gas at 0o?
(ii) At what temperature would the volume of the gas be zero?
(iii) Explain why the temperature in part (ii) above cannot be achieved.
Date posted:
May 29, 2017
-
Figure 10 shows a set up to investigate the relationship between temperature and volume for a certain gas.
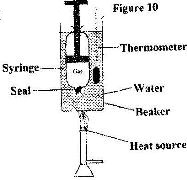 State two factors that are kept constant, in order to determine the relationship.
Date posted:
May 29, 2017
-
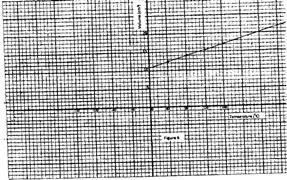
The graph in figure 7 shows the relationship between the pressure and temperature for an ideal gas. use the information in the figure to answer questions (a)and(b).
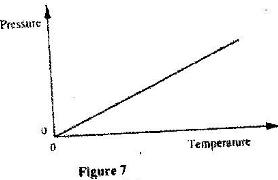 (a) State the unit of the horizontal axis.
(b) Write a statement of the gas law represented by the relationship.
(a) State the unit of the horizontal axis.
(b) Write a statement of the gas law represented by the relationship.
Date posted:
May 29, 2017
-
The pressure acting on a gas in a container was changed steadily while the temperature of the gas was maintained constant. The value of volume V of the gas was measured for various values of pressure. The graph in Figure 9 shows the relation between the pressure, P, and reciprocal of volume, $\fracf{1}{V}$
 (i) Suggest how the temperature of the gas could be kept constant.
(ii) What physical quantity does k represent?
(iii) State one precaution you would take when performing such an experiment.
(i) Suggest how the temperature of the gas could be kept constant.
(ii) What physical quantity does k represent?
(iii) State one precaution you would take when performing such an experiment.
Date posted:
May 29, 2017
-
Figure 6 shows a simple set up for pressure law apparatus.
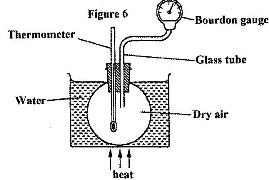 Describe how the apparatus may be used to verify pressure law.
Date posted:
May 29, 2017
-
Figure 7 shows an experiment set-up that may be used to investigate one of the laws. The glass tube has a uniform bore and it is graduated in millimeters.
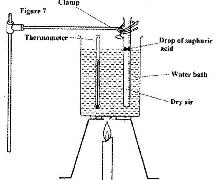 (i) Describe how the experiment is carried out and explain how the results obtained verify the law.
(ii) State two limitations of the set-up.
(i) Describe how the experiment is carried out and explain how the results obtained verify the law.
(ii) State two limitations of the set-up.
Date posted:
May 29, 2017
-
Figure 5 shows a set up that ,a set up that may be used to verify Charles' law.
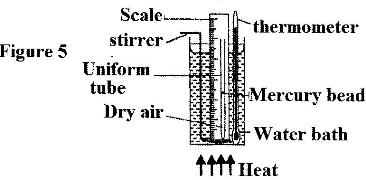 (i) State the measurements that should be taken in the experiment.
(ii) What is the purpose of the water bath?
(i) State the measurements that should be taken in the experiment.
(ii) What is the purpose of the water bath?
Date posted:
May 29, 2017
-
Fig. 2 shows a set-up that may be used to verify Boyle's law.
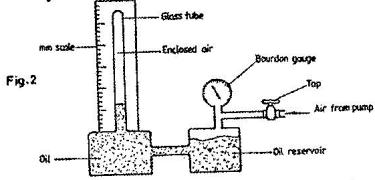 Describe the measurements that should be taken in the experiment.
Date posted:
May 27, 2017
-
Figure 8 shows a graph of the variation of temperature with time for a pure substance heated at a constant rate.
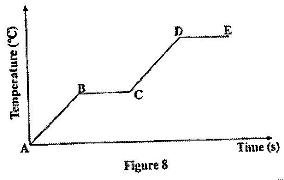 Assuming that heat transfer to the surroundings is negligible, state the changes observed on the substance in region:
(a) BC;
(b) DE
Assuming that heat transfer to the surroundings is negligible, state the changes observed on the substance in region:
(a) BC;
(b) DE
Date posted:
May 27, 2017
-
Figure 8 shows a set-up of apparatus set in an experiment to determine the specific latent of fusion of ice.
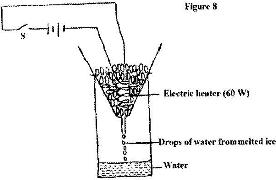 The following reading was noted after the heater was switched on for 5 minutes:
- mass of beaker = 130g
- mass of beaker + melted ice = 190 g
(i) Determine the:
(I) Energy supplied by the 60 W heater in the 5 minutes.
(II) Specific latent heat of fusion of ice.
(ii) It was observed that some of the crushed ice melted even before the heater was switched on. State a reason for this observation.
The following reading was noted after the heater was switched on for 5 minutes:
- mass of beaker = 130g
- mass of beaker + melted ice = 190 g
(i) Determine the:
(I) Energy supplied by the 60 W heater in the 5 minutes.
(II) Specific latent heat of fusion of ice.
(ii) It was observed that some of the crushed ice melted even before the heater was switched on. State a reason for this observation.
Date posted:
May 27, 2017
-
Figure 4 shows a graph of temperature against time when pure melting ice at 0oC is heated uniformly.
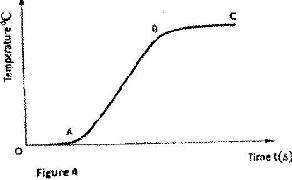 Explain what happens between parts:
(i) OA
(ii) AB
Explain what happens between parts:
(i) OA
(ii) AB
Date posted:
May 27, 2017
-
You are provided with the apparatus shown in fig. 9 and a stop watch.
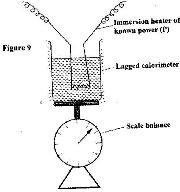 Describe an experiment to determine the specific latent heat of steam, l, using the set up. In your answer clearly explain the measurements to be made and how these measurements could be used to determine l.
Date posted:
May 27, 2017
-
Figure 11 shows the features of a domestic refrigerator. A volatile liquid circulates through the capillary tubes under the action of the compression pump.
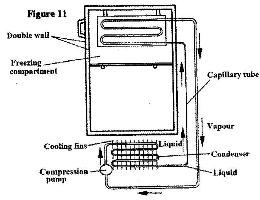 (i) State the reaction for using a volatile liquid.
(ii) what is the purpose of double wall?
(i) State the reaction for using a volatile liquid.
(ii) what is the purpose of double wall?
Date posted:
May 27, 2017
-
Fig. 11 shows the variation of temperature,$\theta$, with time t,when an immersion heater is used to heat certain liquid. Study the figure and answer question.
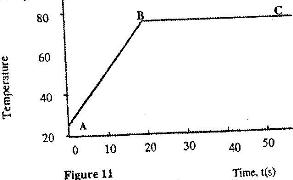 State the reason for the shape of graph in the section labeled BC
Date posted:
May 27, 2017
-
Figure 3 shows two aluminium containers, A and B placed on a wooden table. A and B have equal volumes of hot water initially at the same temperature.
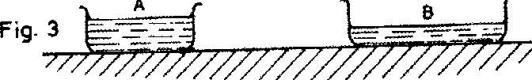 Explain why the water in B cools faster than the water in A.
Date posted:
May 27, 2017
-
Figure 9, shows a circuit that may be used to charge a capacitor.
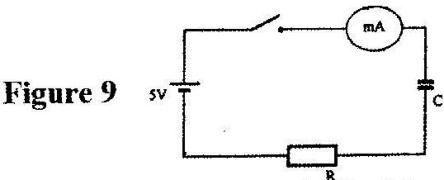 (i) State the observation on the milliameter when the circuit is switched on.
(ii) Explain the observation in (i) above.
(i) State the observation on the milliameter when the circuit is switched on.
(ii) Explain the observation in (i) above.
Date posted:
May 27, 2017
-
Figure 5 shows the circuit used to charge a capacitor C.
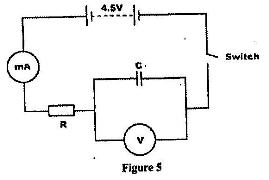 State what would be observed on the following when the switch is closed:
(I) The milliammeter;
(II) The voltmeter;
State what would be observed on the following when the switch is closed:
(I) The milliammeter;
(II) The voltmeter;
Date posted:
May 27, 2017
-
Figure 7 shows capacitors A and B connected in series with a battery of e.m.f 4 V
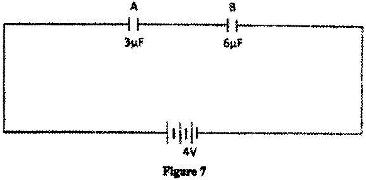 Determine:
(i) The effective capacitance of the circuit.
(ii) The quantity of charge in capacitor A.
Determine:
(i) The effective capacitance of the circuit.
(ii) The quantity of charge in capacitor A.
Date posted:
May 27, 2017
-
Figure 3 shows a voltmeter connected across two charged parallel plates.
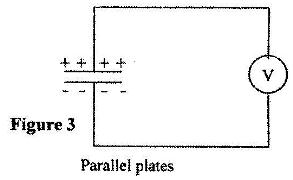 When a thin sheet of mica is inserted between the plates, the voltmeter reading is observed to reduce. Explain this observation.
Date posted:
May 27, 2017
-
Figure 8, shows a circuit that may be used to charge a capacitor.
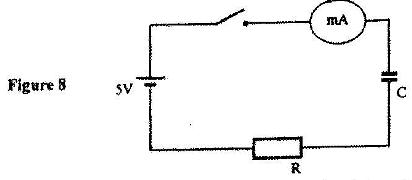 (i) State the observation on the milliammmeter when the circuit is switched on.
(ii) Explain the observation in (i) above.
(i) State the observation on the milliammmeter when the circuit is switched on.
(ii) Explain the observation in (i) above.
Date posted:
May 27, 2017
-
Figure 7 shows a pair of parallel plates of a capacitor connected to a battery. The upper plates is displaced slightly to the left.
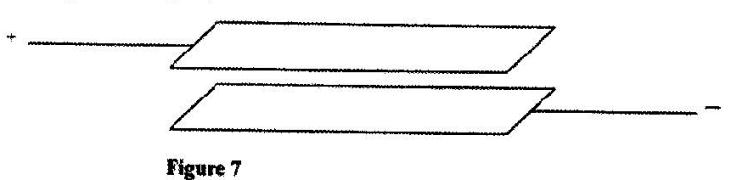 State with reason the effect of this movement on the capacitance.
Date posted:
May 27, 2017
-
The capacitors in the circuit in Figure 14 are identical and initially uncharged.
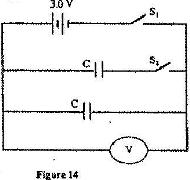 Switch S1 is closed while switch S2 remains open. After sometimes, switch S1 is opened and switch S2 closed. Determine the final reading of the voltmeter, V.
Date posted:
May 26, 2017
-
Figure 20 shows three capacitors connected between two points A and B.
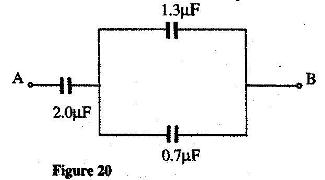 Determine the capacitance across AB.
Date posted:
May 26, 2017
-
Figure 7 shows a "windmill" which when connected to the dome of a positively charged Van de Graff generator is observed to rotate as indicated. A, B, C and D are sharp points.
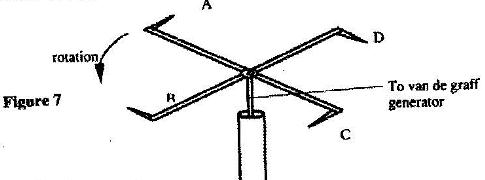 Explain how this rotation is caused.
Date posted:
May 26, 2017
-
Figure 15 shows a battery of e.m.f. 3.0 V connected in series with two capacitors.
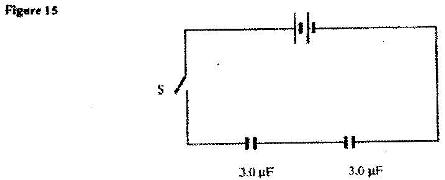 Determine the charge stored in the combined capacitors when the switch S is closed.
Date posted:
May 26, 2017