-
Figure 15, shows two coils A and B placed close to each other. A is connected to a steady D.C. Supply and a switch, B is connected to a sensitive galvanometer.
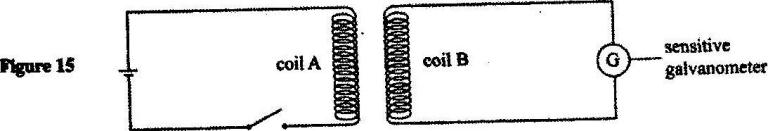 (i) The switch is now closed. State the observations made on the galvanometer.
(ii) Explain what would be observed if the switch is then open.
(i) The switch is now closed. State the observations made on the galvanometer.
(ii) Explain what would be observed if the switch is then open.
Date posted:
June 5, 2017
-
Figure 11 shows a test-tube whose cross-sectional area is 2 cm2 partially filled with lead shot floating vertically in water.
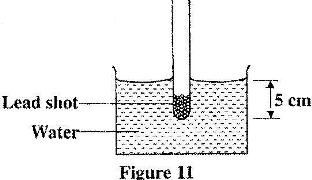 (i) Determine the: volume of the water displaced;
(ii) Determine weight of water displaced.
(iii) State the combined weight of the test-tube and the lead shot.
(i) Determine the: volume of the water displaced;
(ii) Determine weight of water displaced.
(iii) State the combined weight of the test-tube and the lead shot.
Date posted:
June 5, 2017
-
Figure 13 shows a hydrometer with a thin stem floating in water in a beaker.
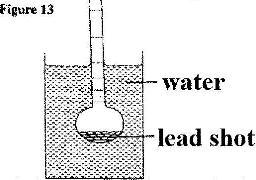 State with a reason what is observed on the hydrometer when the temperature of the water is raised.
Date posted:
June 5, 2017
-
Figure 13 shows a log of wood of mass 20 kg submerged in water in a pond and held in position by a string fixed to the bottom of the pond.
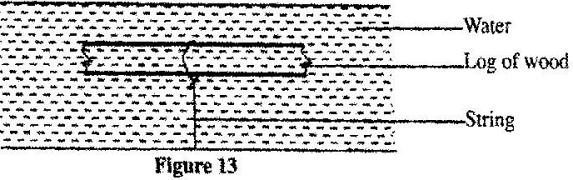 Given that the density of water is 1000 kgm -3 and that of wood is 800 kgm -3, determine the;
(i) Volume of the log.
(ii) Upthrust of the log.
(iii) Tension in the string.
Given that the density of water is 1000 kgm -3 and that of wood is 800 kgm -3, determine the;
(i) Volume of the log.
(ii) Upthrust of the log.
(iii) Tension in the string.
Date posted:
June 5, 2017
-
The system in Figure below is in equilibrium.
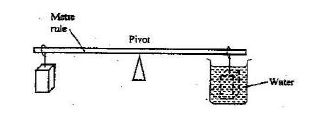 When temperature of the water is raised the system is observed to tilt to the right. State the reason for this observation.
Date posted:
June 5, 2017
-
Figure 14 shows a cork floating on water and held to the bottom of the beaker by a thin thread.
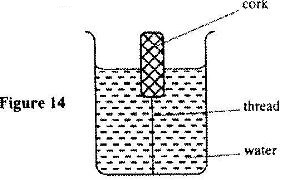 (i) Name the forces acting on the cork
(ii) Describe how each of the forces mentioned in (i) above changes when water is added into the beaker until it fills up.
(i) Name the forces acting on the cork
(ii) Describe how each of the forces mentioned in (i) above changes when water is added into the beaker until it fills up.
Date posted:
June 5, 2017
-
Figure 13 shows a simple hydrometer.
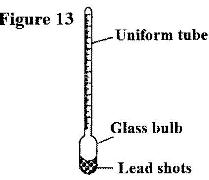 (i) State the purpose of the lead shots in the glass bulb.
(ii) How would the hydrometer be made more sensitive?
(iii) Describe how the hydrometer is calibrated to measure relative density.
(i) State the purpose of the lead shots in the glass bulb.
(ii) How would the hydrometer be made more sensitive?
(iii) Describe how the hydrometer is calibrated to measure relative density.
Date posted:
June 5, 2017
-
Figure 8 shows a container with small holes at the bottom in which wet clothes have been put. When the container is whirled in air at high speed as shown, it is observed that the clothes dry faster.
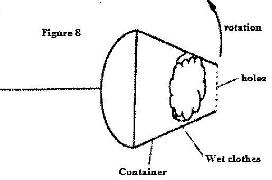 Explain how the rotation of the container causes the clothes to dry faster.
Date posted:
June 2, 2017
-
Figure 8 shows a car of mass M moving along a curved part of the road with a constant speed.
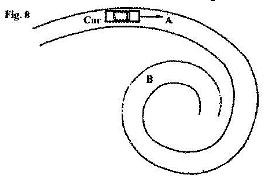 Explain the fact that the car is more likely to slide at B than at A if the speed is not changed.
Date posted:
June 2, 2017
-
cFigure 16, shows a graph of magnification against object distance, for an object placed in front of a lens of focal length 20 cm.
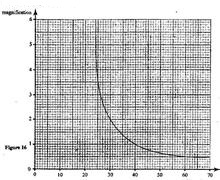 Using the graph;
(i) State the effect on the size of the image when the object distance is increased from 25 cm.
(ii) Determine the distance between the object and the lens when the image is same size as the object.
(iii) Determine the image distance when the object distance is 25 cm.
Using the graph;
(i) State the effect on the size of the image when the object distance is increased from 25 cm.
(ii) Determine the distance between the object and the lens when the image is same size as the object.
(iii) Determine the image distance when the object distance is 25 cm.
Date posted:
June 2, 2017
-
Figure 12 shows the features of a simple camera.
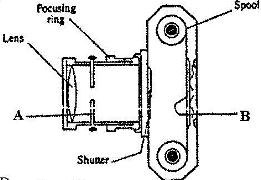 (i) Name the parts labeled A and B.
(ii) A still object is placed at a certain distance from the camera. Explain the adjustments necessary for a clear image of the object to be formed.
(iii) State the functions of the shutter and the parts labeled A and B
(i) Name the parts labeled A and B.
(ii) A still object is placed at a certain distance from the camera. Explain the adjustments necessary for a clear image of the object to be formed.
(iii) State the functions of the shutter and the parts labeled A and B
Date posted:
May 29, 2017
-
Figure 7 shows a horizontal tube containing air trapped by a mercury thread of length 24 cm. The length of the enclosed air column is 15 cm, The atmospheric pressure is 76 cmHg.
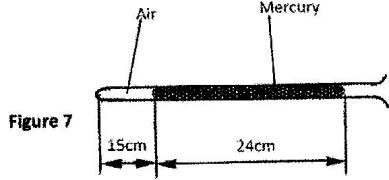 State the pressure of the enclosed air.
Date posted:
May 29, 2017
-
Figure 6 shows a simple set up for pressure law apparatus.
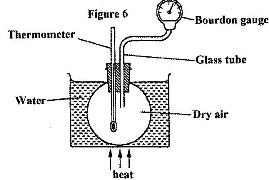 Describe how the apparatus may be used to verify pressure law.
Date posted:
May 29, 2017
-
Figure 7 shows an experiment set-up that may be used to investigate one of the laws. The glass tube has a uniform bore and it is graduated in millimeters.
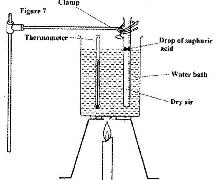 (i) Describe how the experiment is carried out and explain how the results obtained verify the law.
(ii) State two limitations of the set-up.
(i) Describe how the experiment is carried out and explain how the results obtained verify the law.
(ii) State two limitations of the set-up.
Date posted:
May 29, 2017
-
Figure 5 shows a set up that ,a set up that may be used to verify Charles' law.
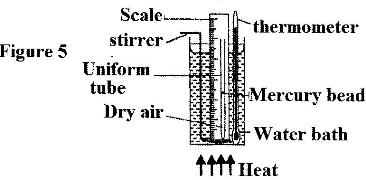 (i) State the measurements that should be taken in the experiment.
(ii) What is the purpose of the water bath?
(i) State the measurements that should be taken in the experiment.
(ii) What is the purpose of the water bath?
Date posted:
May 29, 2017
-
Fig. 2 shows a set-up that may be used to verify Boyle's law.
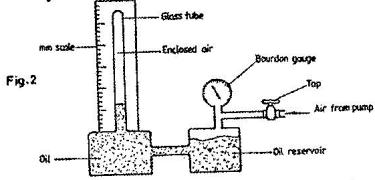 Describe the measurements that should be taken in the experiment.
Date posted:
May 27, 2017
-
Figure 8 shows a graph of the variation of temperature with time for a pure substance heated at a constant rate.
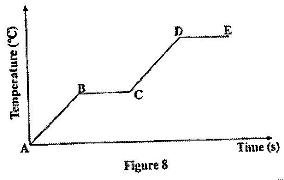 Assuming that heat transfer to the surroundings is negligible, state the changes observed on the substance in region:
(a) BC;
(b) DE
Assuming that heat transfer to the surroundings is negligible, state the changes observed on the substance in region:
(a) BC;
(b) DE
Date posted:
May 27, 2017
-
Figure 4 shows a graph of temperature against time when pure melting ice at 0oC is heated uniformly.
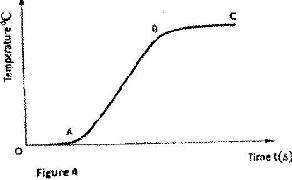 Explain what happens between parts:
(i) OA
(ii) AB
Explain what happens between parts:
(i) OA
(ii) AB
Date posted:
May 27, 2017
-
Figure 11 shows the features of a domestic refrigerator. A volatile liquid circulates through the capillary tubes under the action of the compression pump.
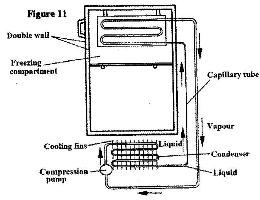 (i) State the reaction for using a volatile liquid.
(ii) what is the purpose of double wall?
(i) State the reaction for using a volatile liquid.
(ii) what is the purpose of double wall?
Date posted:
May 27, 2017
-
Figure 9, shows a circuit that may be used to charge a capacitor.
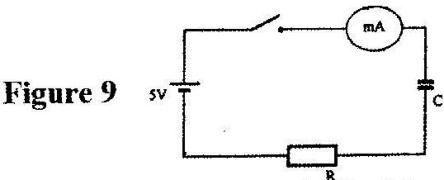 (i) State the observation on the milliameter when the circuit is switched on.
(ii) Explain the observation in (i) above.
(i) State the observation on the milliameter when the circuit is switched on.
(ii) Explain the observation in (i) above.
Date posted:
May 27, 2017
-
Figure 3 shows a voltmeter connected across two charged parallel plates.
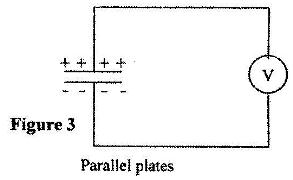 When a thin sheet of mica is inserted between the plates, the voltmeter reading is observed to reduce. Explain this observation.
Date posted:
May 27, 2017
-
Figure 7 shows a "windmill" which when connected to the dome of a positively charged Van de Graff generator is observed to rotate as indicated. A, B, C and D are sharp points.
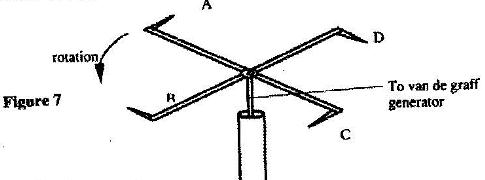 Explain how this rotation is caused.
Date posted:
May 26, 2017
-
Figure 7 shows a sharp pin fixed on a cap of leaf electroscope. The electroscope is highly charged and then left for some time.
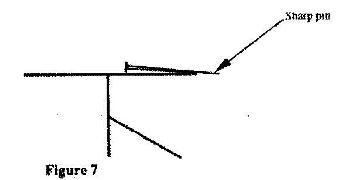 Explain why the leaf collapses.
Date posted:
May 26, 2017
-
In an experiment to observe interference of light waves a double slit is placed close to the source. See Fig. 3
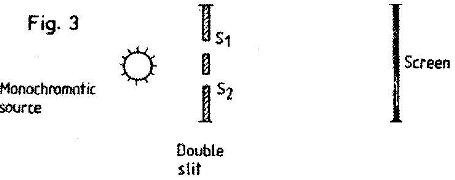 (i) State the function of the double slit.
(ii) Describe what is observed on the screen.
(i) State the function of the double slit.
(ii) Describe what is observed on the screen.
Date posted:
May 26, 2017
-
Figure 9 shows the graph of the relationship between current I and potential difference V for two tungsten filament lamps X and Y. The normal working voltages for the lamp X and lamp Y are 2.5 V and 3.0 V respectively.
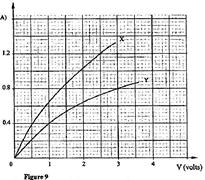 (a) Explain the change in the shape of the curves as the current increases.
(b) Determine the resistance of the lamps X at the normal working voltage.
(c) The lamps are now connected in a series circuit in which a current of 0.4 A flows. Find the potential differences across lamp Y.
(a) Explain the change in the shape of the curves as the current increases.
(b) Determine the resistance of the lamps X at the normal working voltage.
(c) The lamps are now connected in a series circuit in which a current of 0.4 A flows. Find the potential differences across lamp Y.
Date posted:
May 23, 2017
-
In figure 11 the voltmeter reads 2.1 V when the switch is open. When the switch is closed, the voltmeter reads 1.8 V and the ammeter reads 0.1 A.
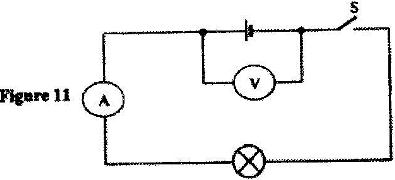 ()
Determine:
(i) The e.m.f of the cell.
(ii) The internal resistance of the cell.
(iii) The resistance of the lamp.
()
Determine:
(i) The e.m.f of the cell.
(ii) The internal resistance of the cell.
(iii) The resistance of the lamp.
Date posted:
May 23, 2017
-
The cell in Figure 10 has an e.m.f of 2.1 V and negligible internal resistance.
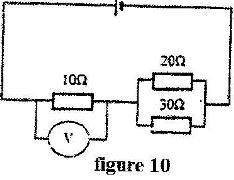 Determine the
(i) Total resistance in the circuit
(ii) Current in the circuit
(iii) Reading of the voltmeter
Determine the
(i) Total resistance in the circuit
(ii) Current in the circuit
(iii) Reading of the voltmeter
Date posted:
May 23, 2017
-
Figure 4 shows an electrical circuit. When the switch is closed the ammeter reading is 0.3 A.
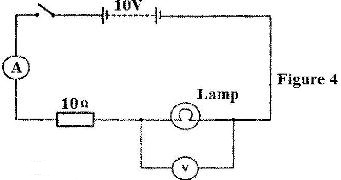 Determine the voltmeter reading.
Date posted:
May 23, 2017
-
The diagram in Fig. 2 represent an electric circuit in which five resistors are connected to be a battery of e.m.f. 4.0 V and of negligible internal resistance.
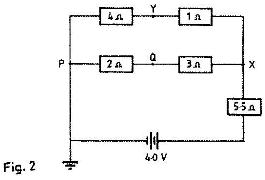 Determine:
(i) The current flowing through the 5.5 resistor
(ii) The potential difference between Y and Q.
Determine:
(i) The current flowing through the 5.5 resistor
(ii) The potential difference between Y and Q.
Date posted:
May 23, 2017
-
Figure 10 shows a trolley of weight 20 N pulled by a force of 4 N from the bottom to the top of an inclined plane at a uniform speed.
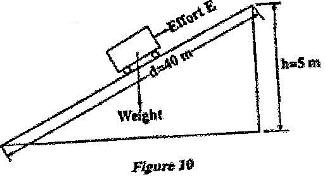 (i) State the value of the force acting downwards along the inclined plane.
(ii) Explain how the value in part (a)(i) is obtained.
(i) State the value of the force acting downwards along the inclined plane.
(ii) Explain how the value in part (a)(i) is obtained.
Date posted:
May 16, 2017